 There's nothing wrong with exploratory analyses - but don't get lost in
them!
There's nothing wrong with exploratory analyses - but don't get lost in
them! Data Analysis
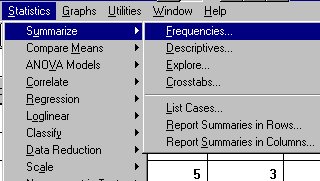
This section will discuss how to analyze your data. Although the instructions are geared to Spss for Windows, the underlying considerations and procedures apply to any statistical analysis software.
Menu
codebook and data
entry
data analysis
frequencies
correlations
recoding variables
creating new variables
comparing means across categories
cross-tabs
Cluster Analysis
Data Presentation.
Now you are ready to start analyzing your data. It is a good idea at
this point to stop and think through what you are going to do. Remind yourself
what your question is, and decide what analyses you need in order to answer
it.
There's nothing wrong with exploratory analyses - but don't get lost in
them!
Presenting your results
For a detailed discussion of how to present results of your analysis, click here: Presenting your results. For the example, I have created two other variables related to group outcomes, following the procedures outlined in the above.
A final word: Don't be afraid to play around with the commands in SPSS
- just be sure you save your data file, and your output file, first! If
you are really paranoid, take your floppy out of the disk drive before
you start experimenting.
I would appreciate receiving your comments and suggestions about this demonstration.
Please e-mail me at cgrd@odin.cc.pdx.edu.
Communication Studies
Mainpage
![]() (PSU
Home Page)
(PSU
Home Page)
This page is maintained by David Ritchie, e-mail:
cgrd@odin.cc.pdx.edu
Last updated on July 29, 1999.