 For
my study of groups, I included one question about outcomes of group processes
for which I included the instruction, "mark all that apply."
For
my study of groups, I included one question about outcomes of group processes
for which I included the instruction, "mark all that apply."
Cluster Analysis: How to Discover Groupings Among Bivariate Data
For
my study of groups, I included one question about outcomes of group processes
for which I included the instruction, "mark all that apply."
Each response was coded as a separate variable, with the value "1" if the subject marked the response and "0" if the subject did not mark the response.
I could analyze each of these variables independently, but it wouldn't be very meaningful - and with fifteen distinct variables, it would be quite tedious. Instead, I will use cluster analysis to discover the way the variables are grouped, and use the results to combine them into a smaller number of variables.
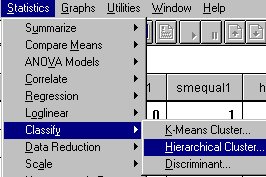
Click on "Statistics," then "Classify," then "Hierarchical Cluster."
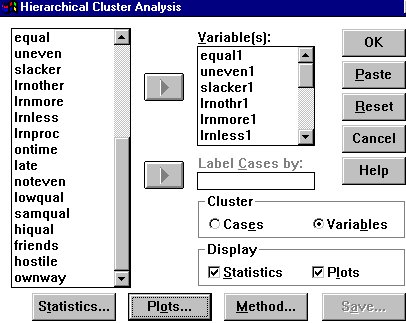
The window to the right will open.
Enter the response variables you want to analyze either by typing their variable names in the "Variable(s):" box or by blocking them and clicking on the arrow. Be careful here to include only variables that really do make sense together.
In the "Cluster" box, you have two choices. "Cases"
will cluster cases - subjects who responded to your questionnaire, according
to how similar their responses are, to the variables you have included
in the analysis. "Variables" will cluster variables. It starts
by calculating for each possible pair of variables how many subjects checked
both variables, ranking these pairs in order of similarity, then looking
for the next similar pair, and so forth. Mark "Variables. 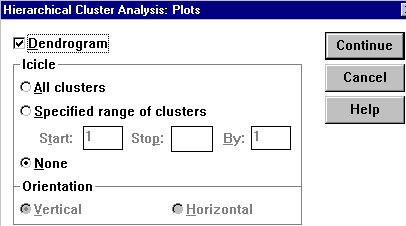
Now click on the "Plots..." button, and the next window will open.
The default output is an "Icicle" plot. However, for our purposes a "Dendrogram" is easier to interpret.
Click on "Dendrogram."
Now click on "Continue," and "OK" to run the analysis.
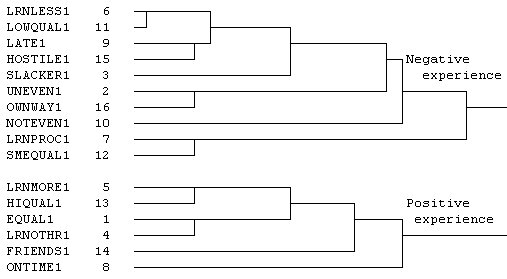
Your output will look something like the screen below and to the left.
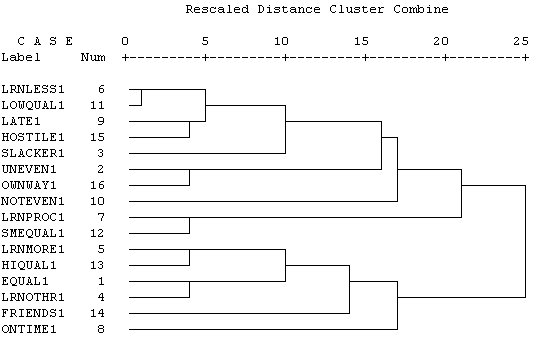
The diagram shows how the variables are grouped together. The closer to the list of variables the connection between any two variables or group of variables is, the more similar they are in terms of how many people marked both.
Note that LRNLESS1 and LOWQUAL1 are the first to cluster together; they are very similar.
Look at the diagram to see how the variables seem to group together. In the Groups data, shown in the diagram to the left, there appear to be two distinct clusters - these clusters are not joined until the very end.
 To
make the analysis more clear, I have separated the two clusters in the
next diagram.
To
make the analysis more clear, I have separated the two clusters in the
next diagram.
Now look at the variables in each cluster, in order to interpret the clusters. In this case, the interpretation is clear: All the negative outcome descriptors are included in the first cluster, all the positive outcome descriptors in the second cluster. It really isn't surprising that these clusters are so distinct, is it!
I can now form a simple variable (ratio level, since it has a true zero point) from each cluster by summing - or averaging - the values. Using the technique for computing new variables discussed in the main document, either use "SUM" or "MEAN." This will result in only two variables in place of the original fifteen.
Note: The main reason that this cluster analysis is so simplistic is that I really had too few cases for a cluster analysis. I have performed this cluster analysis only to provide an example. As it turns out, I did get meaningful and interpretable results - probably because the semantic differences among variables are so clear-cut. Ideally one should have ten or twelve cases per variable; with many fewer than eight cases per variable the results will only be meaningful if the semantic differences among variables are as large as they are in this example.