 Another
common question concerns the relationship between two nominal variables.
For example, is there a difference between men and women in preference
for organizing group tasks to work independently or in groups?
Another
common question concerns the relationship between two nominal variables.
For example, is there a difference between men and women in preference
for organizing group tasks to work independently or in groups? Data Analysis
Cross-tabs: comparing two nominal (categorical) variables
Another
common question concerns the relationship between two nominal variables.
For example, is there a difference between men and women in preference
for organizing group tasks to work independently or in groups?
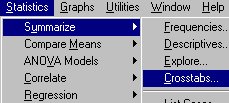
To answer this question, you will want to cross-tabulate the two variables. To run cross-tabs, click on "Statistics," then "Summarize," then "Crosstabs."
The next window you will see is shown on the left, below.
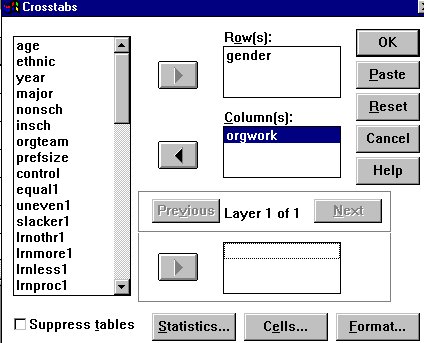
As with the other analyses, enter your data by typing in variable names or by clicking on variable names, then on the arrow.
You can enter more than one variable in both the Rows and the Columns box - but be aware that the number of tables you will get is equal to the product of the two - if you enter four variables in Rows and three variables in Columns, you will get twelve tables.
This will get you a simple table. However, you may want to add some other features. If you click on "Cells..." you can choose to have additional information in each cell of your table, including percentage of row totals, percentage of column totals, percentage of grand total, or "expected value" (what the number in the table would be if there is no relationship between the variables."
If you want to perform statistical tests of the relationship between variables, click on "Statistics..."
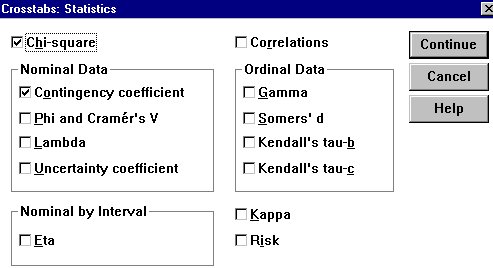
In the Statistics window you will notice that you can choose statistics suitable for either nominal or ordinal data. If either variable is nominal, you must choose nominal data. In this example, I checked "Chi-square" and "Contingency coefficient." In brief, chi-square compares the observed results to the results that would be expected if there is no relationship between variables - by taking the square of the differences. For an explanation of how chi-square ratios are computed, consult a basic statistics text-book.
Click on "Continue," then on "OK" to run the analysis. The results are shown in the table below.
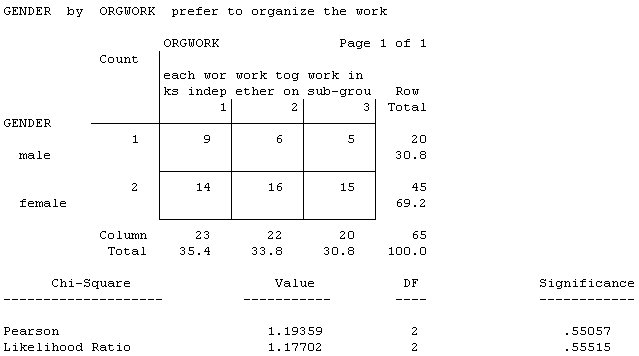
You can tell by inspecting this table that men in this sample are slightly more likely to prefer working independently and women are slightly more likely to prefer working together as a whole group or in sub-groups. However, the chi-square analysis shows that this difference is no greater than would be expected by chance: There is no basis for concluding that the two variables are related.
This is a necessarily simplistic tour of some of the analyses that you can perform with SPSS - or any other statistical analysis software. These analyses will allow you to find - and explain - the most important patterns in your data. In order to go any further - and, indeed, in order to undertand how to use even these analyses correctly - you need to study at least a little elementary statistics.
Continue on to Data Presentation Example
Return to:
Communication Studies
Mainpage
![]() (PSU
Home Page)
(PSU
Home Page)
This page is maintained by David Ritchie, e-mail:
cgrd@odin.cc.pdx.edu
Last updated on July 29, 1999.