
Note: Correlation analysis is meaningless for categorical variables, and very nearly so for bivariate variables. If you have a question for which you allowed several possible responses, and coded each of the possible responses as a separate variable, 1 if the subject marked it and 0 if the subject did not mark it, you can use cluster analysis to see how these responses are grouped in your data. Click here for a discussion of cluster analysis.
To run a correlation analysis, first click on "Statistics," then "Correlate," then "Bivariate." (To understand the other options, Partial and Distances, you need a couple of quarters of statistics.)
The next screen next screen you will see looks like the screen shown
below and to the right.
You can enter as many variables as you like by blocking them, one by one or as a group, and clicking on the arrow. Use the default values (Pearson, Two-tailed) for interval or ratio variables. For ordinal variables, check Spearman.
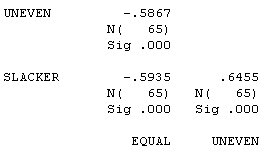
The output is shown in the next screen, below on the left.
Both analyses show that the three variables are highly correlated, consistent with the idea that they represent a common underlying concept.
By way of comparison, the output for Pearson Correlations is shown in the next screen. Although researchers often use Pearson Correlations for Likert-type scales, most methodologists agree that the data from such scales are ordinal. However, as you will notice, the coefficients are quite similar - practically speaking, it probably doesn't make a big difference.
 In
the output from the Pearson Correlation, notice the line of 1.0000s. Each
variable is, of course, perfectly correlated with itself. Correlation coefficients
run from -1.0, for variables that are exactly inverse to each other, to
+1.0, for variables that are perfectly correlated. A coefficient of 0.0
means there is absolutely no relationship between the variables.
In
the output from the Pearson Correlation, notice the line of 1.0000s. Each
variable is, of course, perfectly correlated with itself. Correlation coefficients
run from -1.0, for variables that are exactly inverse to each other, to
+1.0, for variables that are perfectly correlated. A coefficient of 0.0
means there is absolutely no relationship between the variables.
You will also notice that each pair of variables is shown twice, once in the upper right half of the table (above the diagonal) and once in the lower left half.
In both analyses, the number of subjects for whom data are available
is shown in parentheses just below the correlation coefficient, and the
significance level is shown as P= .000. 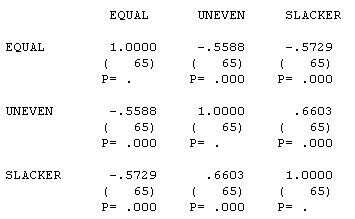 That
means that the actual probability is less than .0005; SPSS rounds to 3
decimal places. Remember, this means "the probability of results this
strong or stronger due to random chance," and it is meaningful only
if the data come from a true random sample.
That
means that the actual probability is less than .0005; SPSS rounds to 3
decimal places. Remember, this means "the probability of results this
strong or stronger due to random chance," and it is meaningful only
if the data come from a true random sample.
To report a correlation coefficient, round it off to two decimal places and report it as follows: "Coefficient of correlation r = -.56, p < .001." If p is > .05, report it as "Variable X and Variable Y are not correlated (r = .11, n.s.)," or better yet, just state that the two variables are not correlated and let it go at that.
Important: If you report the significance level, do not report it as p = .000. The probability of results this strong or stronger by random chance is never equal to zero! There is always some chance, even if it extremely remote. "P = .000" is pure nonsense, and it demonstrates either a poor understanding of statistics or carelessness.
The correct way to report these results is "p < .0005" or, more conventionally, "p < .001."
Notice that "Equal work" is negatively correlated with both "Uneven" and "Slacker - as one might expect it to be.
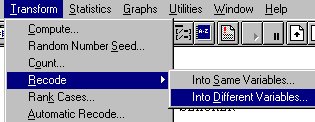
If I want to combine these three variables to form a single variable, I will need to recode them to be positively correlated. We could recode "Equal" to become "Unequal," or we could recode the other two to positive variables. I decided to recode them all to positive variables because I think that will be easier to explain to people.
Continue to discussion of recoding variables
Return to:
Communication Studies
Mainpage
![]() (PSU
Home Page)
(PSU
Home Page)
This page is maintained by David Ritchie, e-mail:
cgrd@odin.cc.pdx.edu
Last updated on July 29, 1999.