I always like to set up the constants that you will be using at the top of the page.
web.pdx.edu/~rueterj/bi445/simulations/simulation1.htm
The purpose of this exercise is for you to understand modelling of algal growth. You will compare how we can approximate exponential growth with a step-by-step model. You will see how resources are depleted from the media as the cells grow. Finally you will understand the relationship between growth, resource depletion, growth rate and the logistic curve.
I want everyone to learn how to create these spreadsheets in Excel. I have provided copies (at the end) that you can download if you are unable to get through the construction.
Part a. Set up a simple table and graph as shown in the following images and graphics.
This spreadsheet and chart compares the increase in cell number as calculated by the step-by-step method to the exponential equation.
Simulation1a should look like this:
I always like to set up the constants that you will be using at the top of the page.
Enter these values and equations in the given cells:
cell
addresswhat you enter what it means A9 0 initial time is zero A10 =A9+$B$6 this adds the value you chose for dt to time each row B9 =$B$5 this sets the start at the initial cell number B10 =B9*(1+$B$6*$B$4) This takes the previous time point (the cell above) and multiplies it times 1 plus the growth rate*dt
This is the stepwise calculation method.
C9 =$B$5 set to the same starting number as the C10 =$B$5*EXP($B$4*A10) This formula calculates the exact value based on exponential curve.

Highlight cells A10, B10 and C10 and drag down to row 29. Fill down, using either the menu Edit-Fill-Down or the keyboard shortcut ctrl D. The values should automatically fill in.
Make a chart of these data by selecting the table (from cell A8 to C29). Go to the chart wizard at the top tool bar or menu (File-Insert-Chart).
In the chart wizard you want to select an X-Y plot with the lines and points.
Your chart should look like this.
Building the spreadsheet is only the first part of this exercise. Now you will change the constants, observe what happens and attempt to answer the following questions.
1. How does changing the initial conditions change the graph?
2. Under what conditions do you get the best match between the step-by-step method and the exact equation? Why?
Modify this spreadsheet by replacing the column on the exponential with a column that shows the decrease in resources (or download )
make cell A7 = "R0"
put the value 500 into cell B7
change cell C8 to "R"
change cell C9 to "$B$8"
change cell C10 to "=IF(C9-(B10-B9)<0,0,C9-(B10-B9))"
this will subtract the number of cells from R with the assumption that each new cell takes up 1 unit of nutrient
it is written as an if statement so that it is always greater than 0
highlight cell C10 and drag down to cell C29 - edit/fill/down
correct the chart if necessary
After you have made these changes, answer the follwowing questions.
question 3. What is the relationship between resources and cell number?
question 4. What happens if the resources are all used up (i.e. go to 0)?
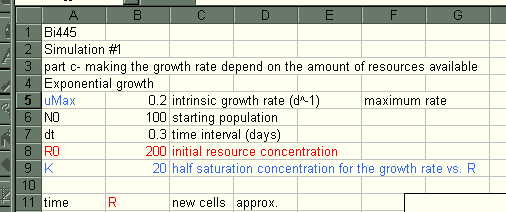
This model has two parts. First is a relationship between u and R and the second is the depletion of nutrients as the cells grow.
I am not going to go through the entire tutorial on how to set up this spreadsheet. Instead I will give you the equations - a picture of the spreadsheet and a picture of the graph that it generates.
Set up a table of the constants that you will use.
These will be:
uMax - the maximum intrinsic growth rate
N0 - the initial population size
dt - the time step
R0 - the initial amount of nutrients
K - the half saturation constant for growth rate relative to R concentration.

Make a table for time, R, new cells and approx.N as shown below.

Put these values and equations into each column
| Cell | enter | what it means |
| A12 | 0 | initial time is set at zero |
| A13 | =A12+$B$7 | adds an interval to time |
| B12 | =$B$8 | sets initial R to R0 |
| B13 | =IF((B12-C12)<0,0,B12-C12) | subtracts the number of new cells from the resources (assuming that each new cell uses 1 unit of nutrient) |
| C12 | =$B$5*$B$6*$B$7*B12/(B12+$B$9) | this calculates the number of new cells that are created in the first time interval (refers to N0) |
| C13 | =$B$5*D12*$B$7*B13/(B13+$B$9) | This calculates the number of new cells for every subsequent time interval - based on the number of cells in the previous time interval. |
| D12 | =$B$6 | sets the initial population to N0 |
| D13 | =D12+C12 | adds the new number to the previous value |
Highlight row 13 and fill down to about row 41.
The chart should look like this:
question 5. Explain the effects of each of these paramters on the shape of the curves:
uMax
N0
dt
R0
K
question 6. What do you have to do to the parameters to get a smooth transition from rapid growth to zero growth.