|
Joseph Maser |
Nehalem
River Watershed Assessment |
Chapters
Contents1.0 Introduction
2.0 Historical Conditions
3.0 Channel Habitat Types
4.0 Hydrology and Water Use
5.0 Riparian Conditions
6.0 Sediment Sources
7.0 Channel Modifications
8.0 Water Quality
9.0 Fish and Fish Habitat
10.0 Watershed Conditions Summary
Home
Projects
PSU
ESR Dept.
Fish and other aquatic life have evolved to deal with a certain amount of sediment within streams. Some erosion occurs naturally within a watershed. The amount of erosion and the subsequent delivery of sediment to streams varies considerably during the year. The largest amount of sediment is moved during high flow events. Land-form changes can occur during heavy precipitation and snowmelt events such as in the February, 1996 flooding.
The challenge is to separate human-caused erosional processes from those that would naturally occur within a watershed. For this assessment, potential sources of sediment were evaluated. Rural road instability, slope instability (not related to roads), and rural road runoff were identified as potential sediment sources. It was determined, according to GWEB guidelines, that surface erosion from range land and crop land was not an issue since all the areas of these land uses are located in low sloped areas (all less than 50% slope). Also, since the total urban area in the watershed is only 0.5% and no major tributaries receive drainage mostly from urban sources, urban runoff was determined as very low priority and not an issue for this assessment.
Methodology
• Road Crossings: The stream theme and street theme (both 1:100,000 scale) were overlaid and all intersections of the two themes were identified to create the “roadcrossings” theme. Queries were made to identify densities of road crossings within each subwatershed.
• Slope Instabilities: From a 30 meter DEM theme, slopes were derived using Arcview. Queries were made to delineate slopes within the following categories: <40% slope, 40-60%, 60- 70%, and >70%. The queries were converted to shapefiles. Additional queries were made to identify extent of each slope class by subwatershed.
• Rural Road Runoff: A 200 foot buffer was created around all stream segments in the stream theme. The street theme was overlaid and road segments that laid within the buffer were digitized to create a new theme, “roadswithin200ft”. Additionally, a >50% slope theme was created and overlaid with the stream, road, and buffer themes. Road segments simultaneously within the buffer and within the >50% slope theme were digitized to create the “roads200steep” theme. Additional queries were made to identify the lengths and densities of streams within 200 feet of streams.
Rural Road Instability
Rural roads include roads that access forest land, crop land, range land, and rural homes. Also, included are state highways and county roads. Information was greatly lacking regarding the existing condition of roads. Data was requested from private land owners, but data was not available. Many private landowners are currently undergoing road inventories that are consistent with Oregon Department of Forestry (ODF) guidelines. Information from these sources is difficult to obtain. The only road information obtained regarding existing conditions from private a private landowner was culvert locations by road mileage from Willamette Industries in spreadsheet format. This data was not available in GIS.
Some culvert locations on state and county roadways were obtained from Tillamook, Clatsop, and Columbia Counties. Culvert information was not available for Washington County. These culverts were prioritized for repair based on the number and status of fish species present and the quantity and quality of blocked habitat, not on the potential impact they may have due to sediment delivery to streams. These culverts will be discussed in the Channel Modifications section. ODF is in the process of finalizing complete culvert information for state lands. The data should be available early in 2000.
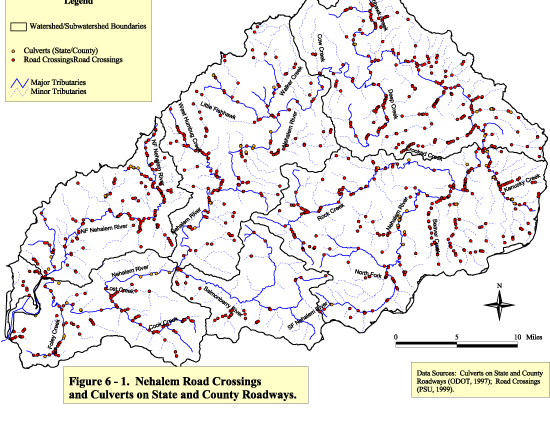
Culverts which are undersized in high fills at stream crossings present a potential erosion hazard. If a culvert is unable to accomodate high flows, the water may go over the roadway carrying loose debris with it and potentially washing out the road. Figure 6-1 shows all of the road crossings in the Nehalem watershed and known culverts on state and county owned roadways. There are 1027 total road crossings. Data is not available to differentiate between
culverts and bridges, however data collection efforts could be started where the road crossing densities are greatest. The North Fork Nehalem subwatershed is the most dense with an average of 1.48 road crossings per square mile. There are 48 culverts identified by the Oregon Department of Transportation on state and county owned roads which are scattered throughout the watershed (see Figure 6-1).
Table 6-1. Road Crossing Densities by Subwatershed
|
Subwatershed |
Area (square mi) |
# Road crossings |
Density (#/square mi) |
|
Cook Creek |
110.08 |
130 |
1.18 |
|
Salmonberry |
71.22 |
40 |
0.56 |
|
Upper Nehalem |
223.05 |
299 |
1.34 |
|
Middle Nehalem |
175.9 |
244 |
1.39 |
|
Lower Nehalem |
177.95 |
168 |
0.94 |
|
North Fork Nehalem |
97.25 |
144 |
1.48 |
Source: PSU, 1999
| Figure
6-1
Click image to see full size image. Use you back button to return to this page. |
Slope Instability
Landslides are a natural part of a landscape, especially in areas of steep slopes and abundant rainfall. Shallow landslides typically occur in very steep terrain. There is some evidence that timber harvest on steep terrain (>80%) increases the likelihood of shallow landslides (Robison et al, 1999) as the roots rot (typically around 4 years post-harvest) until roots of new vegetation have become established enough to hold the soil in place (about 30 years in the coast area). Most deep-seated landslides are natural (GWEB, 1999). The only human-caused impacts seem to be when roads undercut the lower part of a slide or add weight to the top of a slide. Deep-seated landslides are not confined to steep slopes. These landslides can occur at moderate gradients where soil is weak.
The Oregon Board of Forestry adopted most of the current landslide prevention rules on June 8, 1983. Rules for timber management and related road construction were adopted in 1985 in order to mimimize both shallow and deep-seated landslide potential (Robison et al., 1999).
Harvest practices are limited by guidelines which describe “high risk” areas, including active landslides and slopes greater than 80%. In addition, the rules require felling timber to minimize ground disturbance and replanting as soon as possible after logging.
Information is lacking for existing and active landslides. ODF is nearly finished with a three year project delineating potential landslide hazard areas for the entire state of Oregon. The maps will be available in digital form early in 2000. The delineation is mainly based on slope, but rainfall, soil type and historical events were considered when information was available (Smith, 1999).
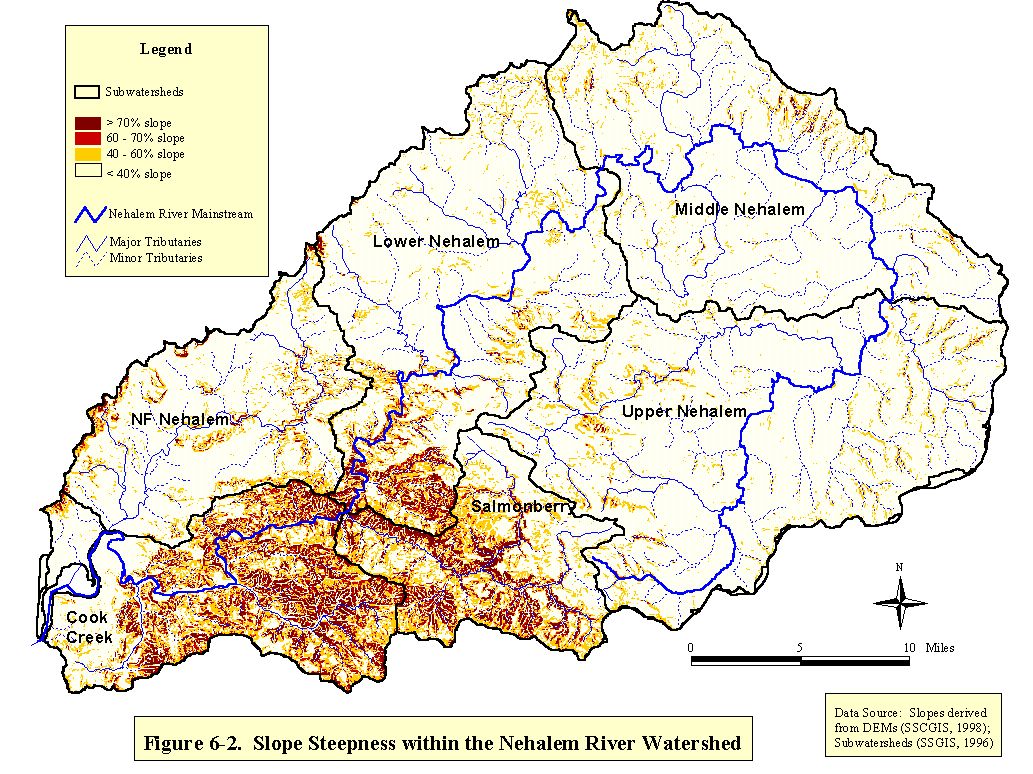
For this assessment, potential landslide hazards were determined according to the risk classification guidelines that ODF is using for their landslide delineation maps. A 10 meter demographic elevation model (DEM) was used to delineate slopes (See Figure 6-2). The classifications are:
Low Risk: Less than 40% slope, essentially no risk of a rapidly moving debris flow. Gentle to moderate slope steepness precludes shallow landslides, but area may be subject to deep-seated, slower moving slides.
Moderate Risk: 40-60% slope, debris flows (moves down-slope as a semi-fluid, watery mass scouring soils from the slope in its path) may occur.
High Risk: 60-70% slope, debris flows fairly common after major storms, and sometimes after moderate storms, steep to very steep slopes with steep stream channels.
Extreme Risk: More than 70% slope, multiple rapidly moving debris flows during major storms and moderate intensity storms. Very steep slopes with confined stream channels.
The Cook Creek and Salmonberry subwatershed have the greatest potential for landslide occurrence. For the Cook Creek subwatershed, the combined high and extreme landslide hazard categories comprised 27.9 square miles which is 25% of the subwatershed area. For the Salmonberry subwatershed, the combined high and extreme landslide hazard categories comprised 14.52 square miles or 20.4% of the subwatershed area (see Table 6-2 below). Special
attention to slopes related to road building, road conditions and forest harvest are especially important in these areas.
Table 6-2. Area of Landslide Hazard Categories by Subwatershed (in square miles)
|
|
|
**** |
Hazard Category |
**** |
Combined High and Extreme/ |
|
|
Subwatershed |
Area |
Low |
Moderate |
High |
Extreme |
Percentage of Subwatershed Area |
|
Cook |
110.08 |
54.29 |
28.03 |
12.87 |
14.62 |
27.49 / 25.0% |
|
Salmonberry |
71.22 |
37.06 |
19.64 |
6.51 |
8.01 |
14.52 / 20.4% |
|
Lower Nehalem |
177.95 |
151.57 |
17.94 |
4.18 |
4.26 |
8.44 / 4.7% |
|
NF Nehalem |
97.27 |
83.42 |
10.78 |
1.69 |
1.38 |
3.07 / 3.10% |
|
Middle Nehalem |
175.92 |
168.12 |
7.08 |
0.44 |
0.28 |
.72 / 0.41% |
|
Upper Nehalem |
223.05 |
209.57 |
12.57 |
0.7 |
0.21 |
.91 / 0.4% |
Data Source: PSU, 1999
Rural Road Runoff
Considerable amounts of sediment can be moved by water which is channeled down roads and associated ditches. Usually, water flowing through a ditch picks up sediment and delivers it to streams.
Unpaved roads with heavy traffic contribute the most sediment to streams. Most of the unpaved roads in the Nehalem Watershed are associated with logging and are only lightly traveled by hunters, fisherman and for other recreational uses (Mallory, 1999).
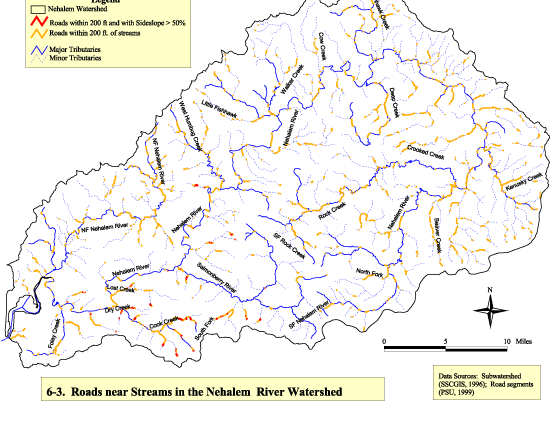
Roads that are within 200 feet of a stream are the most likely to have ditches that flow directly into the stream. These areas are the most difficult to keep from supplying sediment-laden runoff to streams. Within the 1:100,000 scale GIS road theme, there are 214.25 miles of road within 200 feet of streams. This represents 28.53% of the total road length in the watershed. (See Table 6-3 and Figure 6-3).
Roads with steep side slopes usually have more soil accumulating in the road ditches than roads with less steep side slopes. There is the potential for water to carry more sediment to streams. Figure 6-3 shows road segments which are within 200 feet of a stream and have a side slope greater than 50%. The Cook Creek subwatershed has the most road segments in this category with a total of 2.72 miles. The Salmonberry and Lower Nehalem subwatersheds have 0.89 and 0.62 miles of road with steep sideslopes respectively. None of the remaining subwatersheds have roads in this category. The actual amount of sediment contribution to streams from roads within 200 feet with or without steep sideslopes is unknown due to lack of data.
| Figure
6-2 Click image to see full size image. Use you back button to return to this page. |
|
|
Figure 6-3 Click image to see full size image. Use you back button to return to this page. |
Table 6-3. Lengths and Densities of Roads within 200 Feet of a Stream
|
|
|
|
|
<200 ft. from stream |
|
|
|
|
Less than 200 ft from stream |
and sideslope > 50% |
||
|
Subwatershed |
Area (sq. mi) |
Length (mi) |
Density (mi/sq. mi) |
Length (mi) |
Density (mi/sq. mi) |
|
Cook Creek |
110.08 |
31.57 |
0.29 |
2.72 |
0.025 |
|
Salmonberry |
71.22 |
8.58 |
0.12 |
0.89 |
0.012 |
|
Lower Nehalem |
177.95 |
34.78 |
0.20 |
0.62 |
0.003 |
|
NF Nehalem |
97.27 |
26.69 |
0.27 |
0 |
0 |
|
Middle Nehalem |
175.92 |
48.84 |
0.28 |
0 |
0 |
|
Upper Nehalem |
223.05 |
62.33 |
0.28 |
0 |
0 |
|
Total |
855.49 |
214.25 |
0.25 |
4.23 |
0.005 |
Data Source: PSU, 1999
None of the subwatersheds have particularly high densities of roads within 200 feet of a stream. However, Cook Creek has both the highest density of roads near streams and the highest density of roads near streams with steep sideslopes.
Data Gaps
• Complete road inventory data including slumps, cracks, and water running down road or onto an unstable fill. Road surface information and the extent to which the roads are used needs to be identified as well.
• Existing road-related instability data including type of road construction, landslide locations, landslide type, whether or not it reached a stream, what distance it traveled, and road position.
• Complete culvert inventory including locations, capacity, and condition. Calculate drainage area above culvert and calculate peak flow values. Determine whether culvert is appropriate size.
• The Cook Creek subwatershed would have the highest priority for site visits (preferably on a very rainy day) to determine whether actual conditions produce high sediment runoff.
References
-
Mallory, E. Personal Communication, August 18, 1999. Tillamook Soil and Water Conservation District.
-
Robison, G., Mills, K., Paul, J., Dent, L. and Skaugset, A. 1999. Oregon Department of Forestry Storm Impacts and Landslides of 1996: Final Report. Oregon Department of Forestry Forest Practices Monitoring Program.
-
Sessions, J., Balcom, J. and Boston, K. 1987. Road Location and Construction Practices: Effects on Landslide Frequency and Size in the Oregon Coast Range. Western Journal of Applied Forestry 2(4): 119 - 124.
-
Smith, R. Personal Communication, November 27, 1999. Data Specialist, Oregon Department of Forestry.
| Maintained by Joseph
Maser |