1.1 Data Analysis and Python
The hottest topic in the world of business is data analytics, a true 21st century revolution. This course introduces one of the primary data science languages: free and open source Python.
All data analysis in this course is done on the computer. We use Python for data analytics, the same analysis system many data scientists use for real data science, particularly machine learning. (R is the other primary open-source data science system.) At first, you spend some time learning how the Python system works. After that initial setup, the rest becomes more straightforward. From a relatively small investment in learning the system, you gain access to substantial data analytic power, including machine learning.
Moreover, artificial intelligence tools such as ChatGPT and related have changed what it means to learn programming for data analysis. You d advanced Python knowledge to begin useful work.
For meaningful data analysis with AI you only need a basic understanding of the Python development environment, the structure of Python commands, and the logic of the analysis you want to run.
With that foundation, AI can help generate code, explain error messages, revise existing code, and suggest the next step in an analysis. The analyst still needs to understand the goal of the analysis, evaluate whether the result makes sense, and recognize when the output is incorrect or incomplete. Used this way, AI does not replace learning Python. Instead, it lowers the barrier to entry and provides the analyst much more programming power than would otherwise be possible at the beginning level.
With AI support and a basic understanding of Python, you can accomplish sophisticated and practical machine learning and other data analysis tasks. The following material introduces Python at the basic level needed to begin that work. The goal is not to become an expert programmer before doing analysis, but to learn enough Python to understand the workflow, run the code, evaluate the results, and use AI assistance effectively.
1.2 Python vs. Excel
Excel and Python both analyze data by calling functions. You already know more about Python programming than you may think. Excel works with many built-in functions, such as AVERAGE(), SUM(), and COUNT(). Python also works with functions, such as mean(), sum(), and many others provided by Python additions called packages.
Function: A named procedure that performs computations and returns a result.
The input to a data analysis function is data. The output can appear in several forms:
- text, including written summaries and tables
- data visualizations in a graphics format such as pdf or png
- transformed data derived from the original input data
To run a Python program is to process code. That code usually consists of a sequence of function calls that carry out a corresponding sequence of analyses.
1.2.1 Function Calls
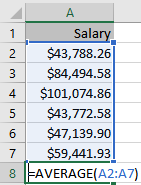
Python and Excel differ in how they tell a function what data to analyze. To illustrate, consider six data values for the variable Salary. In an Excel worksheet, the variable name Salary appears in the first row, and the data values appear below it in the same column. This arrangement is the standard organization of data for analysis: variable names in the first row, with the data values for each variable listed below the corresponding variable name.
What is the average salary? Compute the average, more technically called the arithmetic mean, either with the Excel function AVERAGE() or with the function available in Python, mean(). Both functions compute the same result, but Excel and Python call their functions differently.
Function call: An instruction that runs a function by providing the required input values.
With Excel, enter the function call into a cell in the worksheet, sharing the same type of storage area, a worksheet cell, as the data itself. See Figure 1.1.
In this example, enter the function call beneath the column of data, in the eighth cell of Column A. Specify the data to analyze with a cell range, such as A2:A7. This range refers to the six cells that contain the salary values, beginning in the second row of Column A and ending in the seventh row.
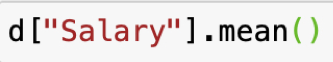
Python works differently. A running Python application provides a workspace separate from the data display. In that workspace, you enter Python instructions sequentially. Instead of referring to worksheet cells such as A2:A7, Python usually refers to data by object and variable names.
A running Python application provides a workspace for entering sequential Python instructions, separate from the data display.
This cell range extends from the second row of Column A to the seventh row. We will deal with the specifics later, but read the data from an Excel file on your computer network into a running Python application into a data table named by you, say d. The data table within Python has its own general name.
Data frame: Data table stored in a running Python (or R) app.
The variable names will be the names in the first row of the Excel data file.
With the data read into data frame d, the Python instruction for computing the average Salary in this d data table with the mean() function, shown in Figure 1.2.
Instructions for a Python data analysis consist of at least several lines of code entered in successive lines.
To do data analysis with either Excel or Python in this example, enter a simple function call to analyze the data. For data analysis, both Excel and Python analyze the data values for a variable organized within a column, though from different user interfaces. Python, however, presents several advantages.
1.2.2 Advantages of Python
Data scientists use Python (or R) for their analyses instead of Excel. The following are some reasons for the preference for Python.
- Python separates the instructions for the analysis of data from the data. This separation makes debugging errors much more straightforward for complicated Excel files that can span multiple worksheets
- Excel is great for data entry and viewing data as a spreadsheet app, but provides only a smattering of basic statistics computations.
- Python offers a wide variety of statistical analyses, from beginner to advanced. level
- Python does Big Data, efficiently handling data sets with millions of observations.
- Python does machine learning analysis, including the most advanced, recent developments.
- Once the concept of working with Python is understood, less time is required to conduct an analysis, such as constructing a histogram instead of clicking and mousing around.
- Obtain each Python analysis with one or more instructions, function calls, that can be saved for future use instead of irrecoverable mouse clicks. The results of Python analyses are reproducible, an important enough concept to merit its own discussion.
The multiple instructions to perform an analysis document exactly how to conduct the analysis. Save these instructions in a file for later use so that the analysis can be repeated, that is, reproduced.
Reproducibility: Analyses can be re-run in the future to reproduce previously obtained results.
The saved Python code is an instruction manual for accomplishing the analysis, a set of instructions anyone with access can repeat. The logic underlying the computations becomes readily apparent. The instructions for analyses done by one person become accessible to all applicable members of the organization at any subsequent point in time, including the original author. On the contrary, the Excel mouse clicks typically disappear into digital dust.
When using Excel you always see your data. That part is good, but there is a huge downside from mixing data with code, which is one reason why data scientists use Python or R instead of Excel for their analyses.
As I wrote in my 2021 article in the Journal of Statistics and Data Science Education (Gerbing 2021):
“From the perspective of data science, Excel worksheets exhibit a fundamental flaw, the confounding of the data with the instructions to process that data. Both data and data processing instructions are entered into adjacent cells stored within the same worksheet. On the contrary, R and Python separately store data and data processing instructions into different files” (p. 251).
Countless overly complex Excel worksheets for business processes are too difficult to debug and understand in their complexity. Much better to separate your data from the code. Let the (small to moderate size) data table reside within Excel, but use Python or R to write your code that manipulates and analyzes your data. Python writes data to Excel files as easily as it reads from Excel worksheets. If needed, export the results of your specified computations back to Excel.
Separate your data from your code to manipulate that data. Data analysis programming languages such as Python and R provide that separation. Excel is much overused so that it can transform to useful to a detriment to many business operations. Welcome, instead, to the world of real data science.
1.2.3 Machine Learning
Python provides a general framework for machine learning. Python itself does not include most data analysis and machine learning procedures. Instead, Python provides a general programming language that can be extended with external packages written for specific purposes. For machine learning, the primary package used in this course is scikit-learn.
One advantage of scikit-learn is that many machine learning procedures follow the same overall structure. After you have completed one machine learning analysis, other analyses use similar syntax:
- Define the model.
- Fit the model to the training data, using the outcome variable the model is intended to predict.
- Use the fitted model to predict future or previously unseen values of the outcome variable.
Before using Python for machine learning, however, we first need to know how to access the environment for developing and running Python code.
1.3 Your Computer or the Cloud
Run Python in the cloud or install it on your computer. The choice is yours. Python code works the same way in either setting. For this course, the cloud option is Google Colab, which runs Python notebooks in a web browser (though you are free to experiment with the Anaconda cloud version as well). The local computer option is Miniconda, which installs Python and related files on your own computer.
Both options are free for the work required in this course. Google Colab may require payment only for more extensive computing needs beyond the basics, such as long-running analyses or heavy use of specialized hardware. For this course, the free version is sufficient.
Running Python in the cloud lets you work from any device with a web browser, including a Windows computer, Mac, Chromebook, or iPad. The main requirement is an active Internet connection. Running Python on your own computer requires more setup, but it lets you work locally after installation and provides a permanent Python system on your machine.
The cloud and local options are not mutually exclusive. You may use Google Colab for some work and Miniconda for other work. The same Python code generally runs in either environment, and notebook files can be uploaded and downloaded across environments.
1.3.1 Install on Your Computer
1.3.1.1 Miniconda Install
Miniconda is a lightweight version of the Anaconda Python system. It includes Python, the conda package manager, and a small number of essential packages. For this course, Miniconda provides what we need without installing the much larger full Anaconda distribution. You could install the full Anaconda distribution instead, but it requires substantially more disk space and includes many packages that we will not use in this course.
Download Miniconda for your operating system: https://docs.conda.io/miniconda.html
- Click the
Downloadbutton in the top-right corner. - Click the
Get Startedbutton on the right side. - Create an account or sign in.
- Choose the Miniconda graphical installer for your operating system and computer type.
- Run the installer and accept the default options.
1.3.1.2 The Command Prompt
macOS: Open the Terminal app in Applications > Utilities
Windows
- Click the Start menu
- Type Anaconda Prompt
- Press Enter
On Windows, use Anaconda Prompt, not the regular Command Prompt or PowerShell.
1.3.1.3 Activate Miniconda
Activate the default Miniconda Python installation, which you will need to do at the beginning of each session:
conda activate baseAfter activation, you should see (base) at the beginning of each command prompt.
1.3.1.4 Install Required Packages
The main packages are:
- scikit-learn: Machine learning models, preprocessing, and evaluation
- XGBoost: Gradient boosting machine learning models
- NumPy: Numerical computation
- pandas: Data manipulation
- Jupyter: Running and editing notebooks
- openpyxl: Reading and writing Excel files
- matplotlib: Basic data visualization
- seaborn: Statistical data visualization
Make sure you see (base) at the start of the command prompt before running the install command from the terminal. The following one instruction downloads all the needed packages, plus their dependent packages, so many packages will download.
conda install -c conda-forge scikit-learn xgboost numpy pandas jupyter openpyxl seaborn
This installs the packages needed for the course, including the Jupyter app for for entering Python code and running Python. Because the seaborn graphics package is dependent on matplotlib graphics package, matplotlib is automatically downloaded with seaborn.
1.3.1.5 Python Project Folder
Before beginning Python program development on your computer, consider creating a folder (directory) for storing your Python projects. While not required, always organize the contents of any project in a distinct directory that you can easily navigate. For example, create a folder called Python in your Documents directory.
1.3.2 Access the Cloud
Google Colab works closely with Google Drive. Colab runs the Python notebooks in the cloud, and Google Drive stores the notebook files. A Google account provides access to both services through a web browser with an Internet connection.
1.3.2.1 Access Colab and Start a Notebook
- Go to: https://colab.research.google.com
- Sign in using a Google account
- Click New Notebook
- Rename the notebook to a meaningful name at the top-left corner
- Enter Python code or text in the first cell
- To add another cell: Click
+ Codeor+ Text - Save the notebook,
File -> Save, which automatically goes to Google Drive - To reopen the notebook later, after logging in,
File --> Open notebook
To manage your files directly, go to Google Drive.
- Go to: https://drive.google.com
- Look for the folder named Colab Notebooks
- Open that folder
- To open in Colab, click the notebook
.ipynbfile
For this course, the CPU runtime is sufficient. A GPU is not required for the scikit-learn examples, though you can experiment if you wish.
1.3.2.2 Runtime Environment
Colab already includes many common Python data science packages, including:
- Python
- scikit-learn
- NumPy
- pandas
- matplotlib
- seaborn
No installation is usually required for most of the examples in this course. If a notebook asks you to install an additional package, run the installation command in a code cell.
1.3.2.3 XGBoost
Later in the course we do use one of the most popular and more recently developed machine learning procedures, XGBoost, which requires a separate installation. If XGBoost is not available in a new Colab session, run this command in a code cell to provide access:
!pip install xgboostGoogle Colab sessions are temporary, so an installed package may not remain available after the session ends or the runtime restarts. If so, then re-install for each session.