1 Data, Visualizations, and Analysis
1.1 Introduction
1.1.1 Visualization and Analytics
We are wonderfully competent visual processors. As we move about our daily life, we do what our ancestors back through the distant past did so well: Effortlessly process a panorama of shapes and images that surround us, patterns immersed within the landscape of our visual world. Modern life, however, delivers a new invention for us to process: data. data: Measurements of characteristics that describe different people, organizations, places, things or events. With data we search for patterns such as normality, trends, and relationships, and we search for exceptions from these patterns. Examine rows and columns of data to uncover this information? Our distant ancestors never encountered data, so our brains never adapted to directly evaluate data.
data visualization: Transform data values into visual objects with easily discernible attributes, such as shape, size, color, and location. The solution? We return to our familiar form: visual images. To visualize data we use computer technology to transform rows and columns of data into visible objects. visual aesthetics: Transform data values into visual objects with easily discernible attributes, such as shape, size, color, and location. We perceive these objects according to their visual aesthetics:
- as different shapes (points, lines, bars)
- displayed at varying sizes (areas, lengths)
- with a palette of different colors (hue, saturation, brightness, transparency)
- which occupy different positions (by axes that define a coordinate system)
Visual aesthetics focus our perception on emergent patterns inherent in the data. The instructions for creating these visualizations found throughout this book provide pleasing aesthetics by default. The resulting visualizations may also be customized to further accentuate the visible patterns and relationships.
data analytics: The analysis of data includes visualization as well as obtaining data, cleaning and organizing data, summarizing data, and building predictive models. Traditional statistical analyses focused more on formal procedures such as hypothesis testing. Modern data analytics emphasizes organizing and preparing data. Apply data visualization and other analytic methods to discover patterns, then build predictive models from those patterns, applicable to both traditional small data sets and big data.
data science: The application of a wide range of data analytic techniques that leads to insight and prediction. The emerging field of data science, which has become a growth engine for jobs, demonstrates the viability of this analytic framework. The data scientist requires knowledge regarding multiple domains: the content area of the application, the relevant statistical techniques and visualizations, the use of the computer to implement the techniques, and the interpretation and implementation of the results. This book focuses on the meaning of those data visualizations and how to use computer technology to obtain them.
A prominent contributor to the techniques and processes of data science, Hadley Wickham, outlined the essential steps for data analysis (Wickham and Grolemund 2017), shown in Figure 1.1.
Figure 1.1: Overview of steps of data processing in an analysis project from Wickham and Garrett (2017).
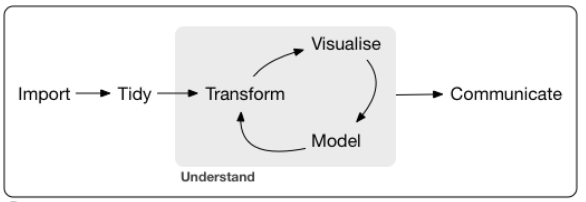
After gathering the data, read the data values from an external data file into the analysis system, or read the data from multiple sources and then integrate into a unified data set. Then clean and prepare the data, ready for analysis in the form of what is called tidy data. This data preparation step, accomplished with its own set of analytic tools, can devour much more time than the analysis itself. Too frequently structural problems with the data’s organization, miscoding, a variety of inconsistencies, missing data, and other issues hinder the data preparation. data wrangling: The process of cleaning, tidying, and otherwise preparing data for analysis. To transform data from its initial version to a cleaned up, tidied version amenable for analysis typically requires the analyst to “wrangle” with the data, too often a time-consuming process.
This data preparation process may also include a further transformation of some variables into new variables. Transformations may be as simple as converting multiple measures of length for different variables into common units such as centimeters. Or, dichotomize a continuous variable into two categories, the lowest half of the values and the highest half of the values. Or, the values of a variable may be squared to conform to a specified statistical distribution.
From a cleaned, organized data set the analysis proceeds with two primary tools: visualization and modeling. The construction and interpretation of models is a central concept of statistical analysis. Models both predict and explain the values of one variable given the values of one or more other variables called the predictor or explanatory variables. The application of statistical models ranges from traditional multiple regression analysis to advanced machine learning procedures. Visualization and modeling iteratively follow each other in succession such that each analysis informs revisions for the other so a skilled data analyst is competent at both analyses.
This book, however, does not address the construction and validation of predictive models. Nor is data wrangling the emphasis of this book, but most data analyses require some data preparation, and so examples are found throughout, listed in the index under Data Wrangling. The focus of this book, however, shows how to create many visualizations of data as data analysis progresses from a basic understanding of a set of data to the communication of results to the intended audience.
- During the discovery phase of the analysis, we explore our data to gain insights into underlying patterns such as relationships and trends.
- At the conclusion of the analysis, we communicate our results to our intended and possibly non-technical audience.
goal: Discover then communicate usable information from underlying patterns inherent in data. Data visualization facilitates both discovery and communication.
1.1.2 R for Data Analytics
R: Comprehensive, open-source, cross-platform software for data analytics.
We power the computations of data analysis with the software system R (R Core Team 2019). R provides functions to accomplish each of the analytic processes outlined in Figure 1.1: data preparation and transformation, modeling, and, of course, visualization.
R is as robust and comprehensive as any data analytic software that is also open-source, free as in costs $0.00, and runs identically on Windows, Macintosh, and the free Linux/Unix operating systems. Always good to have faster computers with much RAM but with moderate size data sets R runs just fine on older, less powerful computers as well.
1.1.3 Run R
1.1.4 Contributed R Packages
1.2 Data
Data analysis begins, naturally enough, with data, the measured data values. Unfortunately, as previously discussed regarding Figure 1.1, data as originally gathered are typically not ready for analysis, sometimes requiring much effort and time to properly organize. tidy data: Table of data with all values for a single person, company, etc. within a row, and all consistently formatted values for each variable within a column. Organize data ready for analysis into a rectangular table, what is called a standard data table or tidy data table, which imposes a strict structure on the organization of the data. Each column of the data table contains the data values for a variable, all data values entered with a consistent format. Each row of the data table contains the data values for a single observation across all the variables in the data table, such as for a single person, company, or geographical region.
1.2.1 Employee Data Example
1.2.2 Types of Variables and Data Values
1.2.3 Read Data into R
1.2.4 Variable Labels
1.2.5 Categorical Variables as Factors
1.2.6 Save the Data Frame
Page built: 2019-10-06