For the Mars I and Mars II labs, you will be using ArcView to access data in the data sticks you were given. This information sheet tells you how to use the software for these labs. The data files were created as a tool to help planning for landing site selection for the Mars Exploration Rovers.
Running ArcView from Lab
Data Jump Drive (Mars I and II labs).
These instructions
assume that you will run ArcView from the jumpdrive and use the data files
stored there. You can do this nominally on any computer, but the
instructions below pertain specifically only to the computers in CH1. (Details
will differ depending on operating system.)
Instructions assume that
the data stick is in drive d.
1. Insert the jump
drive. If you use File Explorer to check the contents of the drive, you should
see a "Data" and a "Program" folder. You will need to acess
both.
2. Locate the following
on the CD: Data > DP_MER_A_B_ELLIPSE46.APR
3. Double click to
load the project. You will get a message: “How do you want to open .APR files?”
4. Uncheck “Always use
this app to open .APR files”.
5. Click on “more apps”
6. Use scroll bar at
right to scroll down to “Look for another app on this PC”. Click once.
7. Navigate to D>
Program > BIN32. Click twice.
8. Click on “Arciew.exe”.
Click twice, or click Open.
9. You will get a
message asking: “Where is c:\windows\system32\alb_09.dbf?”
10. Change drive from c
to d.
11. Select d:\data
12. You will get two
messages asking where to find particular files.
Hit “Cancel” twice (not “Cancel all”).
13. The ArcView program
will open.
-----------------------------------------
To Exit, click “X” at
upper right of Project window. Click Yes to “DO you really want to exit
dp_mer_a_b_ellipse46.apr”
Project Themes, Tools, and Image Windows.
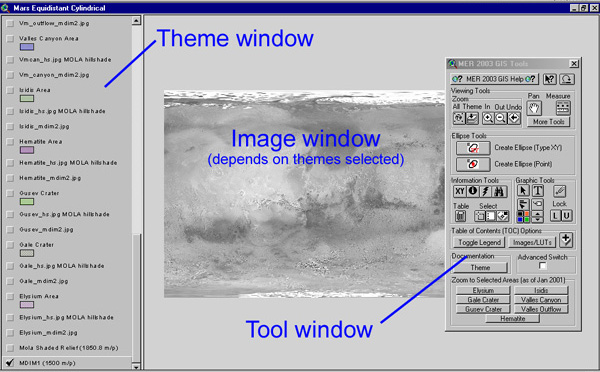
After opening the project, most features are organized in three windows,
an Image window, a Themes window, and a Tools window:
(1) The main Image window shows a portion of Mars using different types of data, depending on what is selected for themes and tools and magnification. It is the window you will be looking at to make measurements.
(2) The Themes window, which can be dragged to different screen locations, contains many different layers (themes), only some of which we will be using for the Astrogeology labs. These contain various data, some planetwide, others for particular locations only. "Check" themes to make them visible; "uncheck" themes to make them disappear. The more themes that are checked, the more layers will show, and the slower the screen will redraw. Use the detailed lab instructions for whichever lab you are doing to determine which themes should be checked at any given point. Always keep the bottom or base theme (MDIM1) checked. The base theme shows albedo and topography.
You can make a theme active by clicking on it twice (not rapidly, but in succession) so that it appears raised. (In the example above, the bottom MDIM1 layer is raised and active.) Designating an active layer is useful because one can use a tool feature called "Zoom Theme" (see below) to quickly see all of the active layer.
The MOLA contours theme shows contour intervals for the equatorial region
(+20 to -20 latitude), whereas the MOLA shading theme near the bottom displays
color-coded topography. The key for topography colors is as follows:
| color in MOLA shaded relief theme | elevation relative to arbitrary datum (km) |
| purple | < -3 |
| dark blue | -3 to -2 |
| light blue | -2 to -1 |
| green | -1 to +1 |
| green-yellow | +1 to +2 |
| yellow | +2 to +3 |
| pale orange | +3 to +4 |
| red to red-purple | +4 to +6 |
| purple to purple-brown | +6 to +9 |
| brown | +9 to +11 |
| brown-white purple | +11 to +13 |
| white | > 13 |
(3) The Tools window, which also can be dragged around the screen, contains various tools.
Here's a view of the Tools window with the Measure Tool selected:
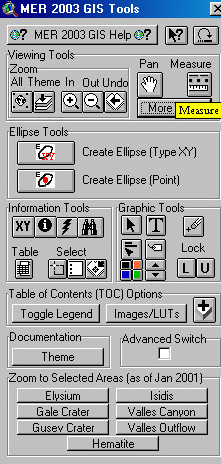
For our purposes, only the following tools are useful:
Information Tools XY After selecting this tool, click anywhere
on the Image window to get a readout of martian longitude (0-360 degrees
west) and latitude (+90 to -90 degrees), where +90 degrees latitude
= north pole, -90 degrees latitude = south pole. The readout is given outside
the other windows at the lower left of the screen. See the section below
called "Map coordinates and scale" for information about the martian coordinate
system to help navigate.
Pan tool. This allows you to drag the map in the Image window
to a different location. Hold-click on a portion of the Image window and
drag to a different location to see a new area. This is the fastest
way to move around, much faster than pointing and clicking with the magnify
or demagnify tool.
Measure tool. Use this for measuring distances (& azimuths)
between two points on the map. After selecting this tool, click on one
portion of the Image window for a start point, move to another point and
click to get an end point. For the line you have drawn, you will
see a distance readout in meters (corrected for planetary curvature) and
azimuths, where 0 degrees = due north, 90 degrees = due east, 180 degrees
= due south, -90 degrees = due west. This is shown at lower left
below the other windows. Note that you get a live readout for distance
(before you click the end point) that differs from the value after you
click and define the endpoint of what you are measuring. To measure
distances, I use the second click to get a reading and you should as well.
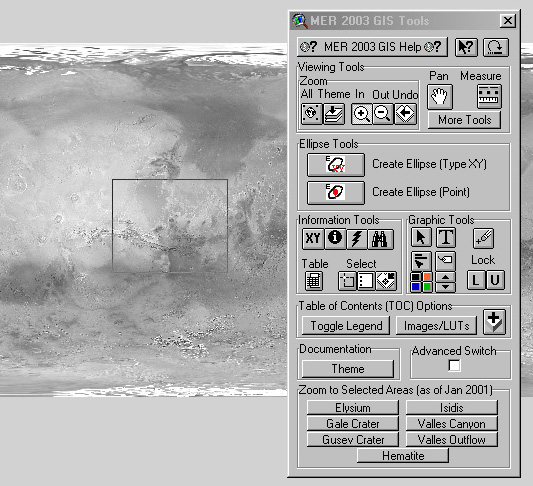
Zoom. Click on the magnifying glass to Zoom In (+) or Zoom Out (-). Either draw a box on the map to zoom to that scale (this is fastest-- see the example below), or click anywhere on the map to zoom in or out in increments on that location. Zoom-Theme quickly zoom so that you can see all of the active theme. Zoom-Theme can be used to quickly get back to the low magnification view that one has when one has the MDIM1 or MOLA shading themes selected as the active layer. This is helpful when one is moving from one part of the planet to another.
In the view below, I've clicked the Zoom In tool and drawn a box with
the cursor (holding it down while drawing) that will magnify to that location
upon releasing the mouse click. The box drawn corresponds roughly
to the Valles Marineris region of the planet you will be examining in the
Mars I lab. You could activate the Zoom In tool and place your cursor
at the center of the box and click several times to get the same approximate
view, but this would be much slower.
Map Coordinates and Scale.
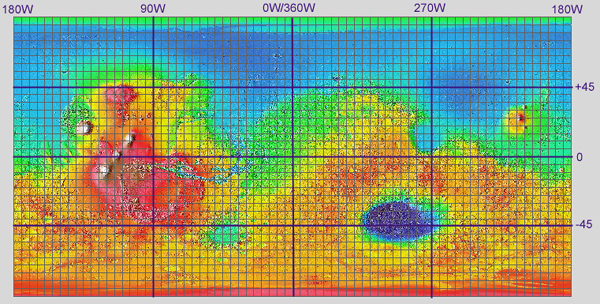
Map coordinates. When zoomed out fully to the MDIM1 or MOLA shading themes, you will see a projection of Mars ("equidistant cylindrical") in which 0 degrees longitude and zero degrees latitude is at the center of the map. The north pole is at +90 (or 90 degrees N) at the top, and the south pole is at -90 (or 90 degrees S) at the bottom. West longitude increases from right to left starting from the middle longitude of 0 W degrees (= 360 W).
The view below shows 5 x 5 lat/long grids on the
MOLA shading theme with some prominent longitudes and latitudes marked
to help you navigate.
Martian longitude/latitude
system
Scale. This is given at the upper right above all of the other windows and depends on the magnification. The smaller the scale numbers, the greater the zoom. To get to a particular scale quickly (you may want to do this for the Mars II lab), you can type in a number and the Image window will be redrawn at the center of the previous view at the appropriate scale. As with everything else, what you see will depend on which themes have been selected, but if you enter too small a scale, nothing will be visible.
Exiting.
When finished, simply exit the program in the normal way by clicking "X" in the upper right corner of the Windows screen. Don't save any changes you may have made inadvertantly to the project (you won't be able to write over the data in any case).