 |
Fig. 1 Reference
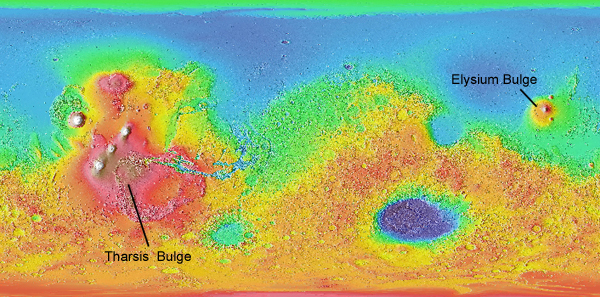
topographic map of Mars showing the Tharsis and Elysium bulges.
(Excerpted from the MER 2003 GIS Mars data CD, MOLA shaded relief theme checked). See ArcView Information for the Mars labs to see the elevation color key. |
Equipment Needed: Computer with internet connection to class website, calculator, graph paper or graphing program (e.g. Excel), and MER 2003 GIS Mars data stick. Show work for partial credit.
Before attempting this lab, read ArcView Information for the Mars labs.
Objectives: This lab has three sections dealing with some of the most conspicuous features of Mars. In Part 1, you will measure the dimensions of two topographically high volcanic provinces known as the Tharsis and Elysium Bulges and infer how they originated and what it means for the interior of Mars. In Part 2, you will evaluate the hypothesis that the large canyon system known as Valles Marineris could have been once filled with water that emptied to surrounding low areas. In Part 3, you will measure some of the dimensions of martian volcanoes, compare them to selected volcanoes on Earth, and consider what these data imply for magma viscosities, rock types, and the interior of Mars.
Introduction.
Martian volcanoes are concentrated in two major provinces-- the Tharsis Province (centered at ~110 W and 10 S) and the Elysium Province (centered at ~215 W, 23 N). See Fig. 1. (For information on the martian coordinate system, see ArcView information for the Mars labs.) The volcanoes in these provinces are built upon two broad topographic "bulges" that are generally higher near their centers, and which are so large that they make a significant distortion in the overall shape of the planet. Gravity data indicate that these bulges have large excess mass compared to the surrounding areas of the planet, and that they are not isostatically compensated. In other words, the topographic highs of the bulges are not fully compensated at depth by low density crustal rock as is generally the case for mountainous areas on Earth.
For this section, the following themes
in ArcView should be "checked" (from top to bottom): 5 x 5 degree grid
(optional; this could be useful for finding longitude and latitude), MOLA
shaded relief , and MDIM1. Make the MDIM1 theme the "active" one.
"Uncheck" all other themes to speed up re-draw times.
|
|
Fig. 1 Reference
topographic map of Mars showing the Tharsis and Elysium bulges.
(Excerpted from the MER 2003 GIS Mars data CD, MOLA shaded relief theme checked). See ArcView Information for the Mars labs to see the elevation color key. |
Q1. It has been proposed that the Tharsis and Elysium bulges are topographically high in part because they contain many overlapping lava flows. Using the MER 2003 GIS Mars data diskette, obtain an estimate of the volume of the Tharsis and Elysium bulges and the lava piles they would have to contain by assuming they can be approximated geometrically as cones. (To measure horizontal distance for this and other questions in the lab, you will need to use the Measure Tool in ArcView after opening a copy of the project on the CD. For information on how to do this, see ArcView Information for the Mars labs.)
Useful formula:
volume of cone = 1/3 * pi * r2 * h = 1/12 * pi * d2 * h
where pi = 3.14, r = basal radius, d =
basal diameter, h = height (relief). Note: the relief is the height above
the surrounding plains.
Q1a. [1 point] Relief of Elysium
bulge, from -1 to +4 km elevation (yellow-green, yellow, orange topography
shading) (km) =
Q1b. [1 point] Horizontal dimension
of Elysium bulge; take 2 measurements at different orientations and average
(km) =
Q1c. [1 point] Relief of Tharsis
bulge, from +3 to +9 km elevation (orange, red, purple, brown topography
shading) (km) =
Q1d. [1 point] Horizontal dimensions
of Tharsis bulge; take 2 measurements at different orientations and average
(km) =
Q1e. [1 point] Approx. volume
of Elysium bulge (km3) =
Q1f. [1 point] Approx. volume
of Tharsis bulge (km3) =
Q2. [3 points] If the bulges are composed of overlapping lavas, they could be analogous to continental flood basalts on the Earth, which are composed of stacked sequences of multiple basalt flows. Some examples are the Columbia River Plateau in the Pacific Northwest (approximate volume of basalt ~174,000 km3), the Deccan Traps in India (~512,000 km3), and the Siberian Traps in Russia (~2,500,000 km3) . These flood basalts were produced by partial melting inside the Earth as a result of hot, upwelling mantle rock. How do the volumes you calculated for the bulges in Q1e and Q1f compare to the largest of the terrestrial plateau basalts, the Siberian Traps? Specifically, calculate the volume ratio of the Tharsis bulge to the Siberian Traps and the volume ratio of the Elysium Bulge to the Siberian Traps. Place your answers (round to 2 significant digits) in Table 1. (For information on significant digits, see the Primer on Significant Digits.)
Table 1. Volume comparison of martian topographic rises to the Siberian
Traps on Earth.
|
|
|
Q3. [2 points] Based on your
answers to Q2, is it reasonable that the bulges consist solely of thick
accumulations of lava? Explain.
Q4. [2 points] If the bulges
are composed of overlapping lavas that erupted in two particular geographic
provinces, what does this imply for how they formed on Mars?
Q5. [2 points] Assuming that
the high topography of the bulges is NOT caused entirely by a thick pile
of lava, what else could make these regions so high?
Q6. [2 points] Gravity data suggest
that excess mass in the bulges must be supported by the strength of the
martian lithosphere. If so, what does this imply about the character of
the martian lithosphere? Is this consistent with what we would expect
for Mars, a small planet compared to the Earth?
Introduction.
Mars has the largest canyons in the solar system. These are known as Valles Marineris (the Mariner Valleys), named after the Mariner 9 spacecraft that discovered them. The canyon network consists of several large downdropped blocks that are generally radial to the Tharsis Bulge and which clearly formed by stresses assocaited with the creation of this bulge. Although normal faulting and graben formation was important in the formation of Valles Marineris, it is clear that material must have been removed from the larger canyons and transported elsewhere-- the canyon bottoms contain younger materials than the surrounding plateaus.
Much of the material in Valles Marineris may have been removed by large floods. Evidence that parts of Valles Marineris were flooded include streamlined layered deposits in the canyons that point down-gradient, the detection of hydrated sulfates in these layered deposits that formed in the presence of water, the presence of chaos terrain in parts of the canyons that are widely agreed to have been the sources of massive floods, and the transition of down-gradient portions of Valles Marineris into large outflow channels. All of the channels around Valles Marineris empty into the Chryse Basin.
For this section, the following themes
in ArcView should be "checked" (from top to bottom): 5 x 5 degree grid
(optional; this could be useful for finding longitude and latitude), MOLA
shaded relief (optional, this topographic data can help you to see the
canyon more clearly, as in Fig. 2), and MDIM1. Make the MDIM1 theme the
"active" one. "Uncheck" all other themes to speed up re-draw times.
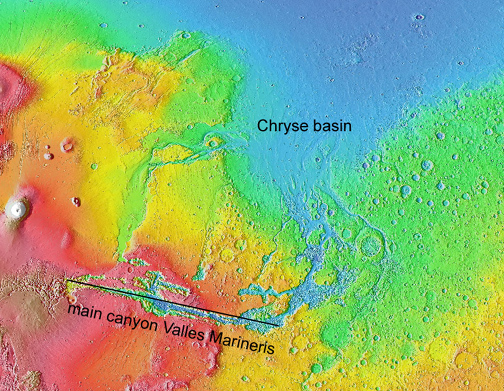 |
Fig. 2 Reference
topographic map showing Valles Marineris & the Chryse basin.
(Excerpted from the MER 2003 GIS Mars data CD, with the MOLA shaded relief theme checked). See ArcView Information for the Mars labs to see the elevation color key. |
Q7. [1 point] Consider the main
canyon of Valles Marineris that extends over 50 degrees in longitude, from
~95W longitude, ~5S latitude to ~45W longitude, ~17.5S latitude (see Fig.
2). Using the MER 2003 GIS Mars data diskette, use the Measure
Tool to determine the length of the main canyon system in km. NOTE:
For comparison, the distance between Portland and New York City is 3941
km.
Q8. [2 points] Ten measurements
of the width of the main canyon (excluding all side canyons) at roughly
equal spacings gives an average width of 150 +- 90 km (mean and standard
deviation). A representative depth of the canyon is 6.5 km.
Calculate
the volume (in km3) of the materials in the main canyon that
could have been removed, assuming a rectangular box where volume =
length x width x depth. As the inputs are good only to 2 significant digits,
express your answer to 2 significant digits.
Q9. [2 points] Calculate the
mass (in kg) that could have been removed from Valles Marineris assuming
a typical silicate rock density of 3000 kg/m3. Note: density
= mass/volume.
Q10. [2 points] Consider the largest
river by far on Earth, the Amazon, which has a discharge (volume flow rate
of water) of 0.763 km3/hr and a suspended sediment load of 3.34
x 109 kg/day where it empties into the Atlantic. Assuming
that sediment-laden water emptied from the main canyon of Valles Marineris
at the same rate as given by the Amazon, how long would it take (in years)
to empty Valles Marineris of the rock that could have once been present?
Q11. [1 point] A more analogous
situation to Mars may be given by the Bretz (a.k.a. Missoula) floods, repeated
floods that coursed through the Pacific Northwest at the end of the last
glacial maximum. Each flood emptied glacial Lake Missoula in Montana
(2048 km3) in about two days, giving a discharge rate of 42.7
km3/hr, about 56 times larger than the Amazon. The floodwaters
from each flood partly filled the Willamette Valley for 2-4 weeks.
Assuming that the load of suspended sediments scales linearly with discharge
(higher sediment loads can be carried for higher discharges), how long
would it take (in years) to empty Valles Marineris of the rock that could
have once been present if floods like those of the Bretz floods had occurred?
Q12. [1 point] Now lets's evaluate
what would happen to all the sediment removed from the canyons by considering
the characteristics of the Chryse basin. Measure the diameter
of the Chryse basin (in km), taking at least two measurements and averaging.
Note: The west side of the basin has a semi-circular line of massifs that
were probably uplifted during the impact that created the basin; these
massifs can be consisdered to represent one edge of the basin.
Q13. [2 points] Modeling the
Chryse basin as circular, to what depth (in km) would it have been filled
with sediments from the main canyon of Valles Marineris, assuming all sediments
from the canyon were deposited there? Note: volume of disk =
pi * r2 * d, where r = radius, d = depth, and pi = 3.14.
Q14. [2 points] Discuss whether
your answer in Q13 is plausible. You should take into account
not only your answer to Q13, but also what was said in lecture class about
this basin (i.e., there is evidence it contains buried structures such
as valleys and smaller multiring impact basins), as well as the topographic
elevation of the current basin floor compared to lowlands to the north.
EXTRA CREDIT PORTION OF LAB. Earn up to 0.8% extra credit by completing the questions in part 3.
Introduction.
Mars has many large volcanoes (Venus also
has big ones) that dwarf those on Earth. All these volcanoes have central
collapse pits known as calderas, produced by the withdrawal of magma from
the vent.
For this section, the following themes
in ArcView should be "checked" (from top to bottom): 5 x 5 degree grid
(optional; this could be useful for navigating longitude and latitude),
MOLA contours, MOLA shaded relief, and MDIM1. Make the MDIM1 theme the
active one. Uncheck all other themes to speed up re-draw times. You
only need the MOLA contours theme checked when you are determining the
heights of the volcanoes.
Q15. [4 points, 0.5 pt each value entered] Using the MER 2003 GIS Mars data diskette, locate the martian volcanoes given in Table 1 below and estimate their basal diameters and reliefs. Note: the relief is the height above the surrounding plain, which may vary around the volcano. To measure diameter, use the measuring tool, and for each volcano take two measurements in perpendicular directions (e.g. one in an E-W and the other in a N-S direction). Show both of these values in Table 1. Measure only the "main" edifices. To measure relief, count the number of 1 km contour lines from the base to the highest summit in at least two directions (east to west, south to north, west to east, or north to south). Show these values in Table 1.
Much data have already been entered for you in Table 1.
Table 1. Worksheet for Mars volcanoes: diameter and relief.
| volcano | comment | long. & latitude* | basal diameter values (km) |
|
|
|
|
|
|
|
|
|
|
|
|
|
|
|
|
|
|
|
|
|
|
|
|
|
|
|
|
|
|
|
|
|
|
|
|
|
|
|
|
|
|
|
|
|
|
|
|
|
|
|
|
|
|
|
|
|
|
|
|
|
|
|
|
|
|
|
|
|
|
|
|
|
|
|
|
|
|
|
|
|
|
|
|
|
*For information on the martian coordinate system, see ArcView Information for the Mars labs.
Q16. [5 points, 0.5 pt each entry] For each of the volcanoes listed in Table 1, calculate the average (mean) basal diameter, relief, slope, and volume, using the data in Table 1. Enter these data in Table 2. The suggested number of significant digits is given in the column header for Table 2. For the volume calculation, assume that each volcano can be approximated as a simple cone. HINT: If you are familiar with using spreadsheets, you could consider doing your calculations in a spreadsheet.
Useful formulas:
slope = arctan (h/r) = arctan (2h/d)
and
volume of cone = 1/3 * pi * r2 * h = 1/12 * pi * d2 * h
where arctan = arctangent (inverse tangent)
function, pi = 3.14, r = basal radius of volcano, d = basal diameter of
volcano, h = height (relief) of volcano.
Table 2. Worksheet for Mars volcanoes: average dimensions, slopes, and
volumes.
| volcano | average
basal diameter (km)
[3 sig. digits] |
average
relief (km)
[1 or 2 sig. digits] |
average
slope (degrees)
[2 sig. digits] |
volume (km3)
|
|
|
|
|
|
|
|
|
|
|
|
|
|
|
|
|
|
|
|
|
|
|
|
|
|
|
|
|
|
|
|
|
|
|
|
|
|
|
|
|
|
|
|
|
|
|
|
|
|
|
|
|
|
|
|
|
|
|
|
|
|
|
|
|
|
|
|
|
|
|
|
|
|
|
|
|
|
|
|
|
|
|
|
|
Before we compare martian and terrestrial
volcanoes, we need to have some information about terrestrial volcanoes.
Table 3 provides data for selected terrestrial volcanoes that include both
small and large volcanoes on Earth. These volcanoes have a range
of morphologies and rock types. Some of these volcanoes (e.g., Mt.
Hood, Mt. Adams) are stratovolcanoes and formed in subduction zones, where
one plate has been underthrust beneath another, resulting in melting of
the subducted slab to produce volcanoes at the surface. Other volcanoes
(e.g., Mauna Loa, Kauai) formed in hotspots, where rising plumes of warm
rock in the Earth's mantle have resulted in melting of the overlying crust
to produce volcanoes. Stratovolcanoes can be distinguished from shield
volcanoes on the basis of slope (lower for shield, higher for stratovolcanoes).
Table 3. Data for selected terrestrial volcanoes.
| volcano | comments | approx. basal diameter (km) | approx. relief (km) | type | main rock type |
|
|
|
|
|
|
|
|
|
|
|
|
|
|
|
|
|
|
|
|
|
|
|
|
|
|
|
|
|
|
|
|
|
|
|
|
|
|
|
|
|
|
|
|
|
|
|
|
|
|
|
|
|
|
|
|
|
|
|
|
|
|
|
|
|
|
|
|
|
|
|
|
|
Using the data in Table 3, the approximate
slope and volume for the selected terrestrial volcanoes have been calculated
using the same procedure you used above for Mars. These values have been
entered in Table 4 and rounded to 2 significant digits.
Table 4. Slopes and volumes for selected terrestrial volcanoes.
| volcano | slope (degrees) |
|
|
|
|
|
|
|
|
|
|
|
|
|
|
|
|
|
|
|
|
|
|
|
|
|
|
|
|
|
|
|
|
|
|
|
|
|
Q17. [5 points]
Compare
the slopes and volumes of martian and terrestrial volcanoes by creating
a scatter diagram (e.g., using Excel, or by handplotting on graph paper)
that plots volcano slope (y-axis) against logarithm of the volcano volume
(x-axis), using the data in Tables 2 & 4. Outline the fields for
terrestrial shield volcanoes, stratovolcanoes, domes, and martian volcanoes,
and
label the axes (including units, e.g., "slope (degrees)") and give the
graph a title (e.g., "Volcanoes on Mars and Earth").
Q18. [2 points] Based on analogy
with Earth, what types of volcanoes seem to predominate on Mars, and how
can you tell?
Q19. [2 points] Why are the largest
martian volcanoes so much larger than their terrestrial counterparts?
Consider how a lack of plate tectonics on Mars might account for this difference.
Q20. [5 points] Create a scatter
plot showing the relationship between volcano slope (y-axis) and approximate
SiO2 content (x-axis) using the data for terrestrial volcanoes
in Tables 3 and 4. Label the axes, including units, and give the graph
a title (e.g., "Relationship between slope and silica content for terrestrial
volcanoes").
Q21. [2 points] Based on the
graph you created in Q20 and the data you obtained for martian volcanoes,
infer what kind of rock type is likely for the volcanoes on Mars.
Explain your answer.