Gathering Data: The Survey Questionnaire
My research questions all had to do with relationships among the following variables: age, gender, preferences for how to organize work groups, and satisfaction with the product of group work. I decided to use a survey, in order to gather data relatively efficiently from a large number of students with recent experience working on group projects. Questions like gender and age are quite straightforward; for the other variables, I developed questions that seemed to get at the central idea. Then I asked a few students - people like the intended respondents to my survey - to fill out these questions and give me feedback. The result is reproduced, in part, below.

To find out how respondents feel about the quality of the group projects, I asked a series of ten questions, which group into three variables related to satisfaction. The first of these variables, "Equal Effort," includes three questions: Everyone does a more or less equal part, The work does not get evenly distributed (reverse scored), and At least one person does little or nothing. The second outcome satisfaction variable, "Positive Experience," includes three questions, We each learn from the others, We learn more about group process than about the topic itself, and Group members become close friends. The third, "Product Quality," includes four questions, We learn more from group projects than from individual projects, Projects are completed late (reverse scored), Some parts of the project are better than others (reverse scored), and Quality is overall lower than individual projects (reverse scored). Before averaging each subjects responses on each set of questions, I changed the reversed scored responses to positive-scored responses by subtracting each score from 6, thus converting a score of 1 to a score of 5, and so on.
If I actually intended to publish the results of this survey, incidentally, I would use this exercise as a pretest, interview a sample of respondents after filling it out, and revise the questions to make certain that each is clear, and that each yields adequate variance. However, the data I gathered from 65 students in two classes will serve adequately for illustrating the process.
Recording Data - the Data File
There are several ways to record data, ranging from a multi-column accounting worksheet to an Excel-type spreadsheet to building a data base in a good statistical program such as SPSS. Here, I will illustrate the use of an Excel spreadsheet for recording data and conducting simple but effective analyses. For a discussion of how to use SPSS, consult the SPSS illustration.

Nominal data can be recorded in either of two ways. You can record short labels for each category ("male," "Indep"), or you can assign a number code to each value the variable can take.
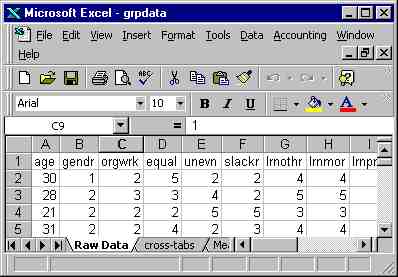
Because I usually analyze data on a program such as SPSS, I am in the habit of using number codes. Thus, for example, I assign "1" for male and "2" for female. The disadvantage of doing it that way is that I will need to remember what each code stands for. (If you work in SPSS, the program remembers for you - but Excel doesn't.) You may want to record the value labels directly, e.g., "male" and "female." However, should you later want to analyze the data in a statistical program, you may need to recode the variables into numeric code.
A small section of my data record in Excel is shown above and to the
left.
Communication Studies Mainpage
![]() (PSU
Home Page)
(PSU
Home Page)
This page is maintained by David Ritchie, e-mail:
cgrd@odin.cc.pdx.edu
Last updated on July 29, 1999.