G 424/524 GIS for the
Natural Sciences
D.
Percy
e-mail: percyd@pdx.edu
Winter Term
Due: Beginning of week 4
Assignment 2
1. Basic Analysis
You will continue to use the data from Assignment 1, trying to add useful layers to your project file. You might be interested in the relationship between landslides and some other spatial variable such as bedrock geology. Let's assume you are! First you need to find out where data that is at a high enough level of resolution (scale) to be of use might reside.
Try these sites:
Geospatial Clearinghouse Network
Can you think of some other potential sources (try googling "gis data download <something you are interested in here>" or similar queries)? Characterize the above sites (plus any you'd like to add!) by usefulness to the Natural Scientist (as opposed to social science). Note what file formats are available, and what coordinate systems are used. Spend at least 2 hours on this outside of lab time. A table is a good way to present the data you collected above!
Part A. Characterize the geologic units by how many landslides occurred in them. You can also analyze the average volume this way. Do this graphically as graphs and with Cloropleth maps . You will need to do summary operations on the tables after you have performed spatial joins. Here is the data to start with (geology_clipped_and zipped) (geologic_unit descriptions lookup), next week you will go download and process these data, for this basic analysis just use what I've supplied.
Steps:
0. Unzip the geology data and add to your landslides map. Use new_geol, as it is 1:500K.
0.5 If you have any landslides selected, unselect them. Right Click on Landslides and choose Data -> Export. Keep track of where you save and what you call it. H:\assignmnt1\landslides.shp is a good example of appropriate location and name. Now you can remove the landslides labeled Events.
1. Spatial Join geology to landslides:
Right click landslides in the legend; choose Joins&Relates; from the first dropdown choose "Join data from another layer based on spatial location", choose new_geol_dd_clip to join to, relationship Falls inside, name the output file and note the location.
2. Summarize number of slides per Geology type
Open the attribute table of the shapefile generated by step 1, right click column to summarize (ptype or recno), choose summarize, click ok to get just the count without any other stats, note the location and name of output table, add result table to map.
3. Open the summarized attribute table (keep track of the Source and Display Tabs!!!) and make a graph of the data:
Right click and open the table output from step 2, click on Options and choose Create Graph and follow Wizard options, right click on blue top bar to get options like export or save on layout.
Alternatively, export the data to Excel or Matlab and graph it there. You have much more control in a real graphing program.
4. Now join the summarized data from step 2 back to the geology polygons (using the field Ptype) and symbolize the polygons by how many landslides occurred in each.
- Right click new_geol in the legend, choose Joins&Relates, Join
- Choose Join Attributes from a table, field based on: Ptype, table to join is whatever you named it in step 2
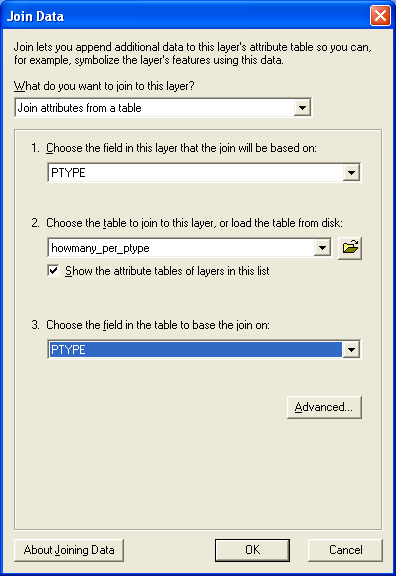
- Rt-Click newgeol_dd_clip, choose Properties, Symbology tab, Quantities, Count_Ptype field, play around with different ways of showing these quantities
Comment on how informative (or not) this join based on Ptype
is! Are there other calculations you could do to help compare different
sized polygons?
Redo step 2 using the recno field instead of ptype (for more details see
instructions above on Cloropleth link).
Be sure to remove the previously joined data (Rt click layer->Joins and Relates->Revove all Joins) before joining your second set of data.
For the write-up:
Try to do a SIMPLE analysis of the data. You have quantitative (tables) and qualitative (maps) data. Thus, you can visually and, at least at a basic level, Numerically Characterize (mean, st dev, variance, etc using the Summarize Field tool) the data. Limit the discussion to volume and frequency (landslides per Ptype). You really can't do much with only these two layers. Why? Remember, we don't just do this for fun, we are looking for answers, what else do you need? Think like a scientist.
IMPORTANT: Be sure to include some introductory text, and an overview of the processing steps. Be sure to include figure numbers and captions, be sure to reference your figures in the text!!! Embed your figures directly in your report, not buried in an appendix. Include your location map from assignment 1. Have fun!!! Discuss what layers of data you might need to really analyze this problem, and why you can't with just this one extra data set.
Also answer these questions based on the readings:
Describe Bonham-Carter's six uses of GIS using specific examples from from a study or subject that you are familiar with or interested in.
Describe classification and entity discreteness (Johnson) in terms of a study or subject you are interested in.