G 424/524GIS
for
the Natural Sciences
D. Percy
e-mail: percyd@pdx.edu
Assignment 1
Creating a location map and adding data.
ArcMap 10
Imagine that you have collected a set of data on landslides in the Portland metropolitan area and need to produce a location map and do a visual analysis of the landslide intensity. You will find basic "basemap" materials in the ESRI data set, and use this landslide file to plot the distribution and volume of landslides resulting from the 96/97 storm event. Here is a copy of the report that accompanied the data set. Below are the instructions to complete the task. On the second time through, you should try doing it without looking at at my detailed instructions which appear in parentheses.
- Download the data file.
- Open ArcGIS.
- From the File menu, choose Add Data->Add XY data. Find your file, choose the spreadsheet named "DATABASE" and choose the appropriate columns for X and Y. Edit the Coordinate System to:
Geographic->North America->North American Datum 1983- Rt-click on the Events object in the TOC, choose Data->Export Data, change the filetype to Shapefile, and call your new shapefile something like Landslides. Be sure to pay attention to where it is saved!
- Add the States and Counties themes from the Esri/Esridata/US directory (I://projects/geodata/gisclass/), you may need to make a new Folder Connection.
- Create a new coverage of just Oregon by using the Select Features Tool (turn on Tools if necessary, see graphic at bottom of page for tool descriptions), selecting Oregon and then Exporting (right-click on layer, Data -> Export, save it to your H: or USB drive as Oregon.shp).
- Similarly limit the counties, save as ls_counties.shp or something similar.Hold down the shift key while clicking on multiple counties.
- Use Graduated Symbols to show which landslides had the largest volumes (right click on layer, layer properties, symbolize, quantities, graduated symbols, choose the volume field). Play with other ways of changing how your landslides are symbolized.
- Sort the attribute table to find the largest landslide by volume (right-click layer, Open Attribute table, right click volume field, choose sort descending)
- Turn on the Drawing tools, Using the Text tool, label the largest landslide. Those callout boxes are kind of cool for this.
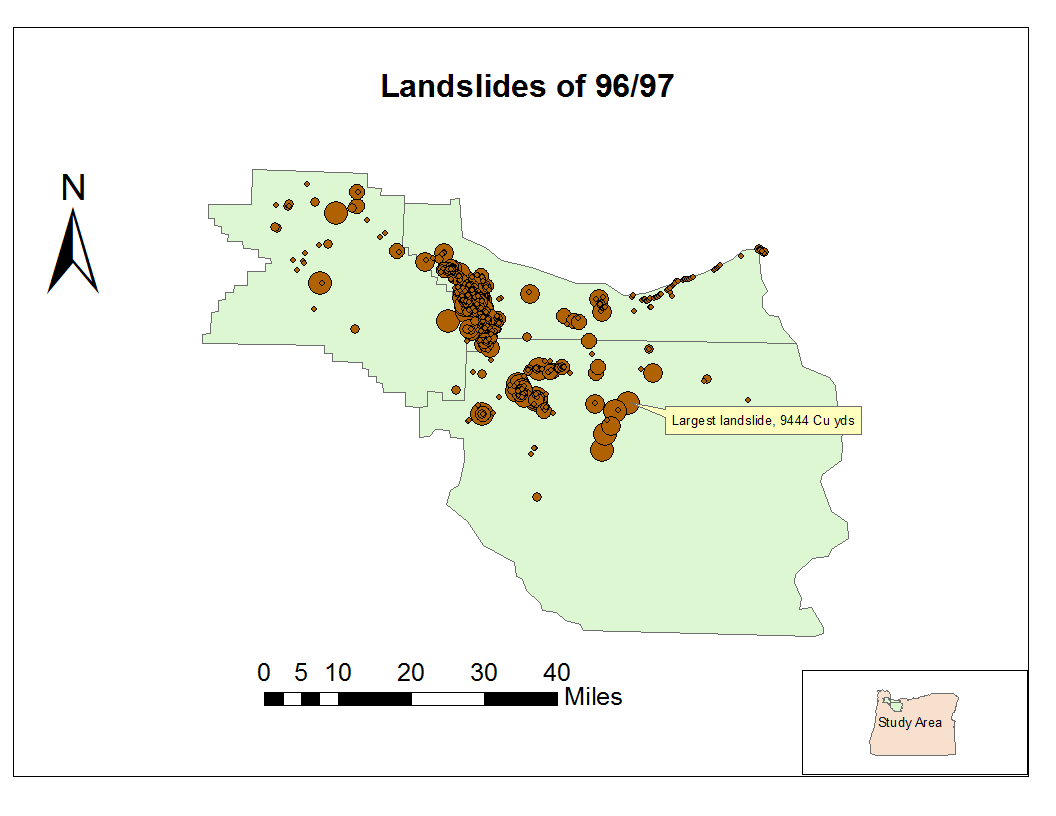
- Create a Layout showing landslide volumes resulting from the 1996/97 storm events.
- Insert a new Data Frame (from the Insert menu) and copy just the Oregon and Counties layers there.
- In your first frame turn on just your landslides and the counties.
- Click the layout button on the bottom of the screen to get into Layout mode. Notice how your two sets of tools interact with the map now.
- Use File->Page Layout to turn the page sideways (landscape)
- Insert scale bar, legend and north arrow elements
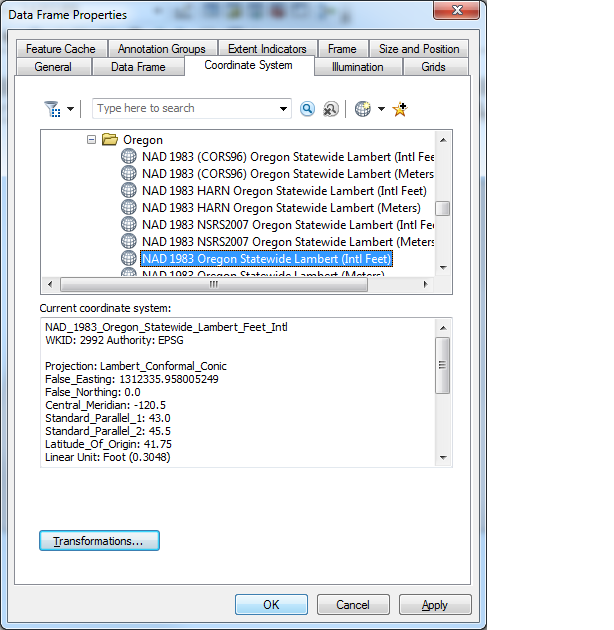
- Change the Data Frame coordinate system to something that looks better (projected, not geographic)
- Drag the various elements around on the screen to achieve an aesthetically pleasing figure that would be used as a location map in a report or article.
- Export map as a PNG to include in the writeup for Assignment 2. That's all you need for this assignment. It might look something like this.
- Start over and DO IT AGAIN!
updated: