Equipment Needed: Internet Connection to Class website and web browser; software for making measurements of scales on images in units of pixels (Photoshop; Arcview can also be used); calculator. To make measurements on images, use image software that enables quantitative measurements to be made, preferably Photoshop, or ArcView if you choose. You will not be able to use image preview software to make measurements on these images. You will need to download and make measurements on the following files: Io-Fig1.tif and Io-Fig3.tif.
Before attempting this exercise, you should familiarize yourself with using Photoshop software for this lab. Click here for Photoshop instructions for the Io and Ice Geology labs.
Objectives: In this laboratory, you will learn about the geology of Io, make estimates regarding the heights of features using trigonometry, and make some estimates regarding volcanic resurfacing rates on the moon.
Introduction. Io, the innermost
Galilean satellite of Jupiter, is somewhat bigger (diameter = 3642
km) than the Earth's Moon, devoid of water, devoid of impact craters, generally
lacks an atmosphere, and is the only place in the solar system besides
Earth, the Saturnian moon Enceladus, and the Neptunian moon Triton that
has confirmed current volcanic activity. The Voyager spacecraft gave us
our first close look at Io in 1977, and more recently, the Galileo Jupiter
orbiter provided even closer views of this volcanic wonderland. Thanks
to Voyager, we now know that besides mass, position in the solar
system also helps determine the extent of geological activity. Io is volcanically
active because it is caught in a gravitational tug-of-war, between Jupiter
on one side, and Europa and the other. This tidal interaction leads to
frictional heating of the interior of Io. (A similar tidal heating effect
occurs for other moons, such as Europa and Ganymede, but to a lesser extent.)
Part I-- heights of volcanic plumes.
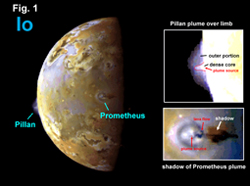
Figure 1 shows two erupting
volcanoes on Io, Pillan and Prometheus, as imaged by the Galileo spacecraft.
Pillan began erupting in mid-1997, and Prometheus has been erupting continuously
since at least 1979, when it was first discovered during the Voyager encounters.
In this image, the eruption plume of Pillan is observed over the bright
limb of Io, whereas the shadow of the eruption plume of Prometheus is seen
near the terminator (the sunlit hemisphere boundary). The close-up images
of the plumes are 3.2 x enlargements of the main photo.
|
Fig. 1. Galileo orbiter image of Pillan and Prometheus erupting on Io. |
1. What is the scale of the global
image and the inset images in Fig. 1? [4 points]
Diameter of Io = ____________________ pixels (express to 3 significant digits-- make sure you understand what this is by reading the primer on significant digits). NOTE: pixels stands for "picture elements", which are the smallest components of an image.
Global image scale = __________________ km/pixel (express to 3 significant digits)
Scale of the insets = _________________
km/pixel (express to 3 significant digits). HINT: This number has
to be a lower number than the global image scale, because the insets cover
a smaller area.
2. How high is the Pillan plume? This plume has a dense inner core (visible as a brighter region) and a more tenuous outer region, but we will make measurements only for the overall tenuous portion. HINT: more accurate results are obtained by using the inset image. [2 points]
Pillan plume height (tenuous portion) = _________________ pixels (3 significant digits)
Pillan plume height (tenuous portion) =
_________________ km (3 significant digits)
3. In Fig. 1, notice the shape of
the Prometheus plume shadow. Infer what this eruption plume would
look like to an observer on the surface of Io by stating in words what
it looks like and by drawing a cross-section view. [2 points]
4. The length of a shadow can be converted to the height of the object casting the shadow by using simple trigonometry.
The formula is: h = [d] x [tan(theta)], where d = shadow length, theta = the altitude (in degrees) of the sun above the horizon at the object, tan = tangent function, and h = height of the object, in the same units as d.
How tall is the Prometheus eruption plume,
assuming that theta = 20 degrees? HINT: more accurate results are obtained
by using the inset image. [3 points]
Prometheus plume shadow length = _________________ pixels (3 significant digits) in inset image
Prometheus plume shadow length = _________________ km (3 significant digits)
Prometheus plume height (to top of dense
portion) = ________________ km (3 significant digits)
5. The 1980 Mt. St. Helens and the 1991 Mount Pinatubo eruptions on Earth sent ash columns to heights of 19 km and 30 km, respectively. These are quite high for the Earth. How many times higher are plume heights on Io compared to these eruptions on Earth? Express your answer to ONE significant digit; give a range (e.g., 2-3 x) if necessary to account for the ranges in plume heights. [3 points]
Table 1. Comparison of volcanic plume heights between Io and Earth.
|
|
|
|
|
Io/Earth |
6. Give three reasons why volcanic
plumes on Io could reach a greater height than on Earth. [6 points, 2 points
each entry]
Reason 1
Reason 2
Reason 3
Part II-- Lava resurfacing rates.
Figure 2 shows volcanic flows
associated with the Amirani hotpsot and plume. (This image has been color-enhanced.)
Image data are shown for 2 flybys of Io by the Galileo spacecraft, from
orbit I24 (Oct. 11, 1999; Day of Year = 283) and from orbit I27 (Feb. 22,
2000; Day of Year = 53). The left color panel shows lava flows (black &
dark brown), SO2-condensate deposits (white-pink) from the Amirani
plume, and S-rich deposits (yellow, red-brown). The rightmost panel shows
areas of new lava in two inset regions (region 1 top, region 2 bottom row).
This new lava was erupted sometime between the two observation dates.
 |
Fig. 2. Galileo orbiter images of the Amirani hostpot area, showing addition of new lava between October 1999 and February 2000. |
The area of new lava in Regions 1 and 2 of Amirani has been estimated by counting the red areas in Fig. 2 as "new lava". Answers are shown in Table 2 and have been rounded to three significant digits.
Table 2. Area of new lava flows near the Amirani hotspot.
|
|
|
|
|
|
7. Calculate the time interval between
the two observations in Fig. 2. [2 points]
Time interval = ___________________ days
Time interval = ___________________ years
(3 significant digits; 1 year = 365 days)
8. Calculate the rates of resurfacing
by lava in km2/year (to 3 significant digits) for Regions 1
and 2 in Fig. 2 and their average, using your answer from Q7 and the data
in Table 2. [3 points]
Table 3. Rate of resurfacing by volcanic flows near the Amirani hotspot.
|
|
|
|
9. Calculate the time needed to resurface all of Io (radius = 1821 km) by volcanic flows, assuming that the average rate you show in Table 3 is representative. Show values to 3 significant digits. HINT: surface area of sphere = 4 * pi * r2, where pi = 3.142. [2 points]
Surface area of Io = _____________________
km2
Time needed to resurface Io by volcanic flows = _______________________________ (years)
10. Give a reason why the global
resurfacing rates you calculated in Table 3 may not be representative for
Io as a whole. In your answer, specify whether the actual resurfacing rate
be higher or lower than you calculated. [2 points]
11. Provide an alternative argument
showing how the resurfacing rates in Table 3 could be representative for
Io as a whole. [1 point]
Part III- Plume deposits and resurfacing
rates.
Figure 3 shows large plume
deposits produced by the Pele and Pillan hotspots.
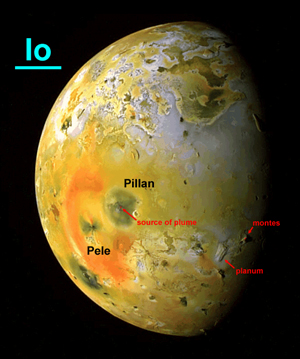 |
Fig. 3. Galileo orbiter image showing plume deposits of Pele and Pillan, together with some mountains (montes) and plateaus (planums). |
The scale of Fig. 3 is found to be 7.0
km/pixel.
12. What is the radius of the Pillan
plume deposit (grey)? [2 points]
Radius = __________________ pixels (2 significant digits)
Radius = ___________________ km (2 significant
digits)
13. What is the approximate area
of the Pillan plume deposit? HINT: area of circle = pi * r2.
[1 point]
Area = _____________________ km2
(2 significant digits)
Pillan was not active in 1977, when Io
was observed by the Voyager spacecraft. Some 20.5 years passed without
apparent activity at Pillan. Then, observations made by the Galileo orbiter
on April 4, 1997 revealed a plume deposit (Figure 4, right),
a large plume over the limb of Io (Fig. 1), and excess thermal emission
corresponding to Pillan. The deposit from Pillan covered the orange-colored
plume deposit from the Pele hotspot (Figure 4 left), but
did not completely cover other landforms with topographic relief, such
as the large caldera (volcanic collapse crater) known as Reiden Patera
(Fig. 4).
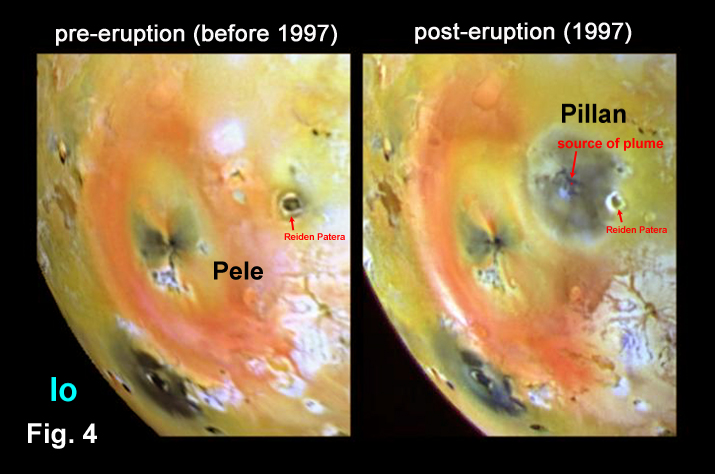 |
Fig. 4. Voyager (left) and Galileo orbiter (right) images showing the apperance of the Pillan plume deposit sometime between 1977 (left) and 1997 (right). |
14. Calculate the rate of resurfacing
by Pillan-like plume deposits, assuming that Pillan had an eruption interval
of 21 years. As this is a minimum time interval for Pillan (it may have
erupted long before 1977 when Voyager first imaged the area), it will lead
to a maximum rate. [1 point]
Rate of resurfacing = _____________________
km2/year (2 significant digits)
15. How long would it take to resurface
all of Io by plume deposits, assuming that the rate you calculated for
Pillan in Q14 is representative for Io? [1 point]
Time to resurface Io = ____________________
years (2 significant digits)
Compare the resurfacing rates on Io by volcanic flows (Table 3) with that of volcanic plume deposition (Q14).
16. Provide an argument why lava
resurfacing rates may be more likley to represent the rate at which impact
craters are obliterated on Io. [2 points]
17. Provide a contrarian argument
explaining how volcanic plume deposition could more effectively obliterate
craters on Io than lava. [2 points]
Part IV-- Mountains and plateaus.
18. Fig. 3 also shows large isolated
mountains (montes) and large plateaus (planum). These features are casting
shadows and are representative of the tallest features on Io. Using shadow
measurements and trigonometry (the same procedure as in Q4), calculate
the height of the montes and planum indicated in Fig. 3. Assume the local
sun angle for the montes and planum is theta = 10 degrees and 25 degrees,
respectively. [6 points]
Montes shadow length = ____________________
pixels (2 significant digits)
Planum shadow length = ____________________
pixels (1 significant digit)
Montes shadow length = ____________________
km (2 significant digits)
Planum shadow length = ____________________
km (1 significant digit)
Montes height = _______________________
km (2 significant digits)
Planum height = _______________________
km (1 significant digit)
19. Sulfur is a leading candidate
for producing yellow, orange, and brown coloration on Io. Owing to low
strength, the maximum stable relief for landforms composed of sulfur is
believed to be only several hundred meters, perhaps 1 km. Silicates have
more internal strength and can support much more relief (as we know from
Earth). Based on the measurements made in Q18, what does this imply for
the composition of the montes? Of the planum? [2 points]