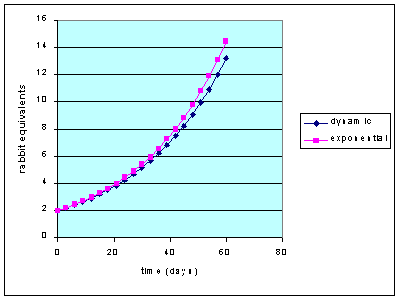
The graph will look like this.
We will explain why there is a difference between the two curves.

We want to produce a chart that compares a dynamic model of rabbit growth to the exponential equation model.
The population of rabbits grows at an instaneous rate that is the same as one doubling per month, i.e. equal to a specific growth rate of 1 rabbit per rabbit per month, or 1 month^-1. This rate is equal to .033 d^-1.
We will compare two models.
|
The graph will look like this.
We will explain why there is a difference between the two curves. |
 |
| 1. Open Excel | |
|
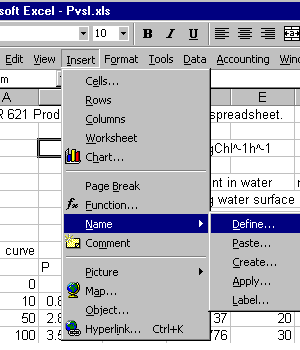
Naming the parameters - this helps manipulate the model for comparisons. 2. type "Nzero" (without the quotes) into cell A1, select cell B1, go to the pull down menu Insert/name/define
|
 |
| 3. After naming cell B1, put the value 2 into the cell. | |
|
4. Do the same in cells A2 and B2 with the name "dt" and the value 1. |
|
|
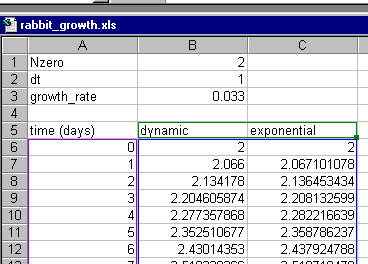
5. Do the same in cells A3 and B3 with the name "growth_rate and the value 0.033. The top of your spread sheet should now look like this |
 |
|
6. Label columns A, B and C in cells A5, B5 and C5 respectively A5 is "time (days)" |
|
|
7. put initial values in cells A6 is 0 If you did all the steps to this point correct cell B6 and C6 should show the value that you assigned to the parameter Nzero, i.e. 2. |
|
|
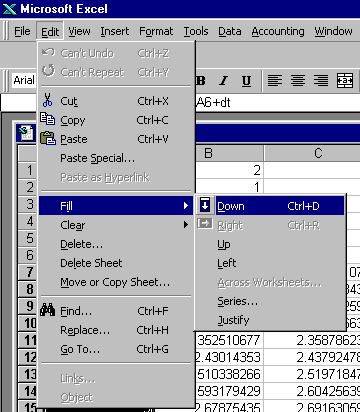
8. Fill in a column of times put this equation into cell A7 "=A6+dt" The value of cell A6 should show 1 highlight cell A6 and drag down to cell A36, release the mouse and then fill down
|
|
|
you can fill down by hitting Ctrl D or by Edit/Fill/Down.
After you fill down, you should see a column of time values from 0 to 30. |
 |
|
9. Insert the following formula into cell B7 "=B6+B6*growth_rate*dt" This equation adds a small increment of new rabbits to the previous number of rabbits. The amount that it adds is the growth rate (growth_rate) times the time step (dt). When you enter that formula, you should get a value just greater than 2. select cell B7, drag down to B36 and fill down. The values should fill in. |
|
|
10. Insert the following formula into cell C7 "=Nzero*exp(growth_rate*A7)" This is the algebraic formulation for an exponential curve. In Excel e to the power of blah-blah is exp(blah-blah). Select C7, drag down and fill. |
|
| You should have three columns that look somewhat like this. |  |
|
Finally, make an X-Y chart of these three columns so that you can compare the behavior of the two models. You will be able to change just the parameter in the named cell, dt for example, and see how longer or shorter time steps effect these models. |
|
| If all else fails - you can download the Excel model rabbit_growth.xls from this site. | |
Which model gives lower values? Why is this?
What happens to the difference between the two curves if you make the time step (dt) larger or smaller?
What is the number you get after one month if you start with one rabbit equivalent at a growth rate of 1 per month (i.e. 0.033 day^-1)? Is this a number or a letter?
John Rueter
ESR 202
January 14, 2001