http://web.pdx.edu/~rueterj/cyanolab/pvsi_fitting_steps.htm
We are using the model of Platt et al. to describe the relationship between Productivity (O2 production) and light energy. This model uses the tanh function to estimate the saturation of light harvesting machinery.
For a description of P vs. E curves in general, see Pvs.I notes from Bi445
For a justification of why the tanh function is used to describe a Poisson distribution, see Poisson.htm from Bi445.
We try to determine four parameters:
alpha mol O2 min^-1 light ^-1 biomass^-1 describes the initial slope of the curve 0 < E < 100 uE m^-2 s^-1
Pmax mol O2 min^-1 biomass^-1 maximum rate of O2 production, this paramter is easy to derive if there is no photorespiration or photoinhibition beta photoinhibition/photorespiration factor that determines how the curve slopes off at higher light resp mol O2 min^-1 biomass^-1 dark O2 consumption, measured as the Y intercept at 0 light We are not using Ik as a parameter. It is equal to
Ik = Pmax/alpha
The equation is:
P = Pmax*(1-exp(-alpha*I/Pmax))*exp(-beta*I/Pmax)
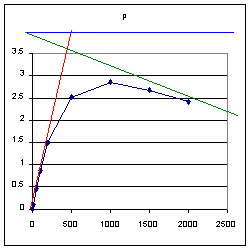
A typical curve might look like this:
The problem is that that there is no simple way to estimate Pmax and beta independently.
We developed a three step process that makes the selection of paramters more reproducible. Our parameter set for each set of data is not necessarily any better than any other solution, but can they can be compared.
Step 1.
Step 2.
Step3.
These steps and example data are all on an Excel spreadsheet, pvsi_fitting_steps.xls
Platt, T., C.L. Gallegos and W.G. Harrison 1979. Photoinhibition of photosynthesis in natural assemblages of marine phytoplankton. J. Mar. Res. 38: 687-701.