courses/notes/esr473/inefficiency/inefficiency.htm
February 16, 2002
edited 2006.06.05
Draft for class use - ESR473
Efficiency in algal regulation:
Comparison of several strategies.
John Rueter
Environmental Sciences & Resources Program
Portland State University
rueterj@pdx.edu
This paper presents the comparison of much algae grow with different combinations
of regulation strategies (algorithms) working in different light environments.
The working hypothesis is that regulatory strategies are more important than
the efficiency of the mechanisms that are being regulated. The efficiency of
particular mechanisms under steady state conditions are only part of the story
of competition. The purpose of this exploration is to get a rough idea about
the potential inefficiency related to regulation.
General characteristics of the algal growth and regulation model
This model is based on the optimization principles of Shuter (1979) that have
modified such that the cell can reallocate new growth into different components
(Pmemb, Penz, EnzBiosynt, and Structure). This model uses a cell with 20 pmol
C cell^-1 and a maximum production rate of carbon that saturates with light.
The allocation adaptation model works with the following simple algorithm:
in each time step, determine which potential rates are the lowest
calculate the growth rate by taking the minimum function of these rate limiting
steps
allocate a constant amount (0.10) of the new growth in time step T into the
structure that will represent cells in time step T+1
allocate a variable amount into other components based on the number of components
that are determined be limiting and the allocation weighting factor
See the Excel workbook for details of the equations in the different time step
models.
inefficiency_sim.xls
Environmental patterns to be tested:
| constant light |
set at L=20 to L=100 |
| |
|
| step functions |
for example sf100-50,2
step function between light =50 and light =100 with two hours at each
light intensity
|
Regulation algorithms
| perfect tracking |
Instantaneous shift to optimal output computed
for each point. Used for estimation of inefficiency, not a regulatory
strategy. This is not an actual strategy because there is no allocation
or change in the cell that can achieve instantaneous reallocation or change
with zero cost. |
| set composition |
The relative components of the cell are set,
and unchangeable with time, to the composition determined at the specified
light intensity. |
| allocation |
Allocation into new components depending on
the demand. The demand can be even or it can be weighted toward Pmemb,
Penz, or EnzBiosyn. |
Optimal ratios of components
The optimal ratio of components will result in all components being used to
the same efficiency. If one component is in excess, that carbon could be better
invested in another component which would lead to an increase in growth. The
cellular components and their relative efficiencies is derived from Shuter (1979).
Over a range of light the optimal allocations range widely. At low light, the
allocations are mostly into the light harvesting Pmemb (Table 1). At high light
the allocation is heavily in EnzBiosyn that is needed for growth rate.
Table 1. Optimal composition ratios for different light levels. These were
determined by letting the equal allocation model run for 100 time steps. The
variations in growth rate between 0.071 and 0.069 probably result from the
way these are calculated in the last time ten steps of the simulation and
are probably not real variation. There is no reason for L=75 to have a higher
maximum growth rate than any other high light.
| LIGHT |
Pmemb |
Penz |
EnzBiosyn |
Nassim |
Struct |
mu |
| 10 |
0.59 |
0.07 |
0.20 |
0.04 |
0.10 |
0.035 |
| 20 |
0.45 |
0.11 |
0.30 |
0.05 |
0.10 |
0.051 |
| 35 |
0.34 |
0.13 |
0.37 |
0.05 |
0.10 |
0.063
|
| 50 |
0.29 |
0.14 |
0.41 |
0.06 |
0.10 |
0.070
|
| 75 |
0.27 |
0.15 |
0.42 |
0.06 |
0.10 |
0.071 |
| 100 |
0.22 |
0.19 |
0.41 |
0.08 |
0.10 |
0.070 |
| 200 |
0.21 |
0.20 |
0.41 |
0.08 |
0.10 |
0.069 |
| 500 |
0.20 |
0.21 |
0.41 |
0.09 |
0.10 |
0.069 |
The output for set ratio compositions or variable allocation strategies can
be compared to the theoretical maximum growth that would result from perfect
instantaneous growth rate tracking of the environment. For example as the light
changes from 50 to 20, the growth rate also takes a step function from 0.070
to 0.051 instantaneously. It is interesting to note how close to perfect the
set-ratios are when compared to the constant light condition (Table 2).
Table 2. Comparison of growth in cells under constant light with a set ratio
of allocation compared to equally weighted dynamic allocation. The values
in ( ) are the percent of perfect growth as calculated by mu at each time
step.The proportional allocation were taken from Table 1.
| |
constant
L=20 |
constant
L=35 |
constant
L=50 |
constant
L=75 |
constant
L=100
|
| Perfect tracking |
5930 (100%) |
18454 |
39060 |
39060 |
39060 |
| set-ratio(20) |
5929 (100%) |
5929 |
5929 |
5929 |
5929 |
| set-ratio(50) |
1200 (xxx%) |
12107 |
34592 |
34592 |
34592
|
| set-ratio(100) |
536 (xxx%) |
3158 |
15286 |
34952 |
34952 |
| allocation(even) |
5742 (xxx%) |
20185 |
37680 |
36826 |
35286 |
Adaptation response in the allocation model
Under constant light this allocation algorithm results in a stair step response
(Figure 1). The allocation into one component provides enough new component
so that in that time step or the subsequent time steps no more will be required.
The components that are not increasing are in excess and thus decreasing the
efficiency of growth. The stair steps can be "smoothed" out by decreasing
the time step. There may be justification for having a finer time scale than
one hour, but the net effect would have to be explored. Does a finer time scale
really reduce the total amount of time that components are in excess, or does
it just cut that time into smaller increments?
The stair step response can be seen in Figure 1-a for a constant light condition.
Varying the light, for example between 50 and 20, leads to accentuating these
stair steps. As the light shifts to 20, the cell needs to synthesize more Pmemb
and Penz, EnzBiosynt, and Nassim components will be be in excess. Anytime there
is an excess in one component it represents an inefficiency.
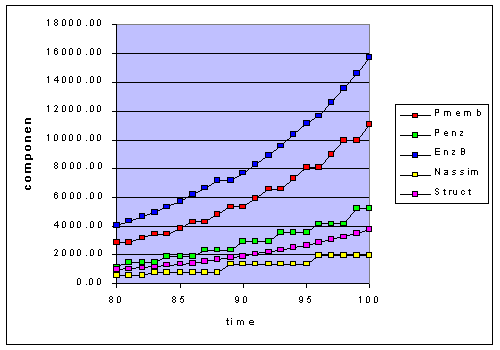
Figure 1a - adaptation to constant light (L=50). The last 20 hours are shown
to illustrate the "stair steps".
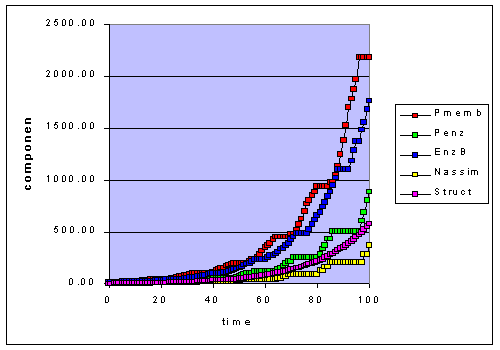
Figure 1b. Adaptation to 50-20 step functions at 8 hour intervals. The components
change both because of the adaptation algorithm and the light variation.
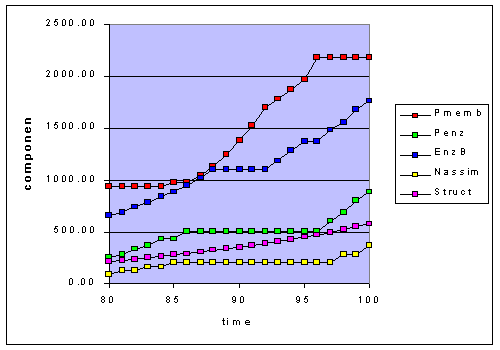
Figure 1c. Adaptation to the 50-20 step function at 8 hour intervals focusing
in on the last 20 hours. The light was at 50 from 80 to 87 hours, then it
changed to 20 from 88 to 95, and finally at 50 again from 96 to 100.
Set intermediate ratio
One potential strategy is to adapt to a step function is to set the composition
at a ratio optimized for an intermediate light. For example if the step function
is between 50 and 20, set the cell composition for cells adapted to L=35 (see
table 1). For a 50-20 step function of length 2, the L=35 adapted cells perform
11% better than the L=20 and 2% better than the L=50 cells. All of these set
ratio cells perform at least 56% better than the equal allocation model and
up to 117% better. This indicates that set ratios, i.e. adapting to a constant
ratio, is a viable strategy that should be considered.
The even allocation adaptation regime shown in Figure 1 results in variations
in the instantaneous growth rate (Figure 2) in a 50-20 8hr time-step regime.
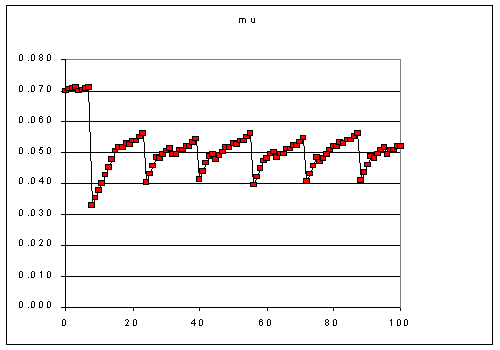
Figure 2. variations in instantaneous growth rate on a 50-20 8 hr time step.
The initial 8 hours at 50 are high because the cell was started at the component
ratio optimized to L=50. The subsequent pattern of variation is 8 hours attempting
to adapt to L=20 and the next 8 hours attempting to adapt to L=50. Because
of the lower growth rate at L=20, the adaptation is more constrained. By the
end of the 8 hours however, the cells have just reached the growth rate of
0.051 that is maximum for that light.
Longer time step lengths allows more time for the allocation strategy to work.
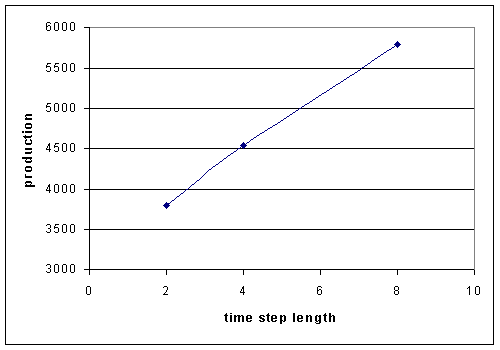
Figure 3. Production after 100 hours for the even allocation strategy in
the 50-20 step function environment increases with time step length.
The amount of change necessary to adapt to adapt is also a factor in the efficiency.
Cells at L=100 and L=50 grow at the same rate but the component ratios are different
(see Table 1). A two hour time step function between 100 and 50 results in only
61% of the perfectly tracked growth. This limitation can be shown to be mainly
the result of the poor performance of the L=100 adaptation at L=50. Cells that
work to adapt to L=100 pay a big price when the light shifts back down to L=50.
The 50-20 step function is even more limiting, resulting in only 25% of the
perfectly tracked growth. Again, even though L=100 and L=50 adapted cells have
the same potential growth, their composition is different and the 100-20 time
step has even a wider degree of adaptation to handle and only performs at 19%
of the perfectly tracked growth.
Variable weighted allocation
The components in the cell are not always needed in the same ratio. Weighting
the allocation algorithm can provide relatively more component either because
that component is inherently less efficient (such as EnzBiosyn fraction which
is about 1/6 as efficient as either Pmemb or Penz) or as a response mechanism.
For example it might be advantageous for cells to invest rapidly in new Pmemb
when the cell shifts to lower light.
In this model, there doesn't seem to be an advantage to weighting allocations
into Pmemb. Increased weighting factors from 1(even) to 3 result in decreased
production at both 2 hour time steps and 8 hour time steps (Figure 4).
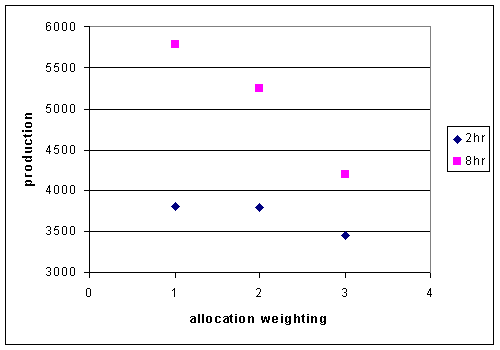
Figure 4. Production of the allocation model with changes in the weighting
of the allocation into Pmemb.
The weighted allocation model was used to explore optimal weights for the EnzBiosyn
fraction with different time steps (Figure 5). The time steps were 2, 4 and
8 hours at 50 then 20 em^-2s^-1. Each of these series has an optimal weighting
ratio between 3 and 4, with the shorter time steps having a higher weighting
factor.
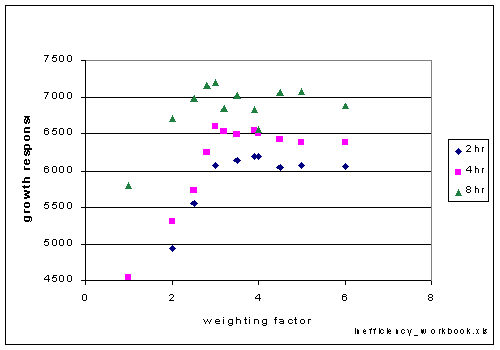
Figure 5. Variations in the weighting factor for the EnzBiosyn fraction result
in different productivity's. The length of the time step was varied between
2 and 8 hours. The optima for the 2 hr step length is at a weighting factor
of 4 times, and for both the 4 hr and 8 hr time step lengths the optima is
a weighting factor of 3 times.
Best strategy for each environment
This paper compares several strategies and several environments for potential
productivity. Within this limited set, there are clear winners in each category
(Table 3). The runner up category is important for evaluating the robustness
of different strategies. The winner in a particular environment could be an
example of overfitting with little generalization. For example, the winner under
constant light at 50 and 100 was the even allocation algorithm probably because
the set maximum growth rates for 50 and 100 were slightly underestimated or
the values were truncated when transferring from one table to another table.
The top three data rows of Table 3 show how close the even allocation algorithm
can come.The other rows show that fixed ratio strategies do very well but the
allocation strategies usually come in second place, showing robustness.
| Environment |
Winner
|
Second place
(%of winner) |
| constant(20) |
set(20) |
allocation-even
(97%) |
| constant(50) |
allocation-even |
set(50)
(93%) |
| constant(100) |
allocation-even |
set(100)
(98%) |
| stepfunction(100-50,2) |
set(50) |
allocation(even)
(68%) |
| stepfunction(100-20,2) |
set(50) |
set(20)
(92%) |
| stepfunction(50-20,2) |
set(35)
An intermediate strategy |
allocation(Enz*4)
(94%) |
| stepfunction(50-20,4) |
set(35) |
allocation(Enz*3)
(96%) |
| stepfunction(50-20,8) |
allocation(Enz*3) |
set(50)
(96%) |
Table 3. Winners and runners up for different environments. The constant
environments were at 20, 50 and 100. The step functions were between lights
100, 50 and 20 for 2, 4 or 8 hours. Not all strategies were tested in all
categories. See the summary of results table in the spreadsheet for the listing.The
allocation strategies were either even or the component*weighting factor.
Conclusions
One question that arises from this research is whether the inefficiency in
adapation is due to the required change in the composition or the limitation
of production rate. With only light as a variable, these two portions of the
response are inextricably linked. The exploration of N limitation would allow
us to set the growth rate and to manipulate the cellular composition to a different
set of ratios.
This limited set suggests other strategies and environments that should be
tested. New environments should include sin functions for light and fluctuating
light. New strategies to be tested should include one that introduces metabolic
variability such that individual cells would be maintained at different ratios
of cellular components. One approach to this is the cellular automata method
employed by Rueter (****) that introduces genetic variability into a competitive
community. This research showed that mutants could persist in a community because
their regulatory strategy gave them a competitive advantage even though their
kinetic parameters were suboptimal. This test of "mutant losers" showed
the importance of regulatory strategies in overall competition studies. Another
method would be to explore the grammar of regulation directly. Are their regulatory
grammar constructs that could be favorable in fluctuating environments? Preliminary
work in this areas suggests that the complexity of the grammar is related to
the number of physiological states expressed by cells. A persistent number of
physiological states could be advantageous in fluctuating environments, similar
to how the intermediate set strategy was successful in this study.
One conclusion can be tentatively drawn from this limited set of comparisons;
if it isn't broken don't fix it. Cells with fixed allocation strategies were
winners in five out of eight environments that were tested here. This result
indicates that dynamic allocation strategies have a cost, and this cost is not
necessarily recouped. Generalizing from this, again with caution, it may not
always be justified to make physiological inferences of the form; this organism
has the physiological characteristics of organisms adapted to L=50 therefore
it must come from an environment where L=50 is an important factor. As demonstrated
in Table 3, cells adapted to L=50 were actually the winners in a step function
environment with short steps that didn't allow time for adapation. Similarly,
only at longer time steps (8 hrs) did the rapid allocation of production into
the enzyme and biosynthesis machinery payoff. At shorter time steps an intermediate,
no change strategy was superior. These results show the potential advantage
of not pursuing a physiological optimization strategy.
References:
Rueter - paper from Hawaii symposium
Shuter 1979

