

a. interpolation
generating a value from in between data points
within the range of observations
probably go for fit with least computational effort
examples:
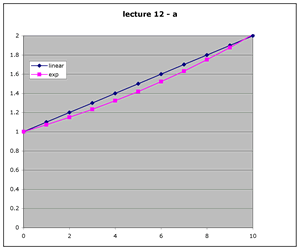
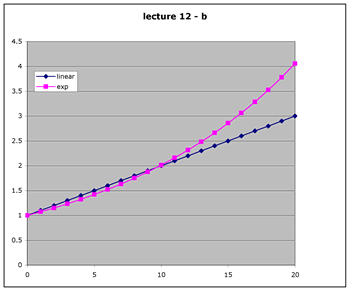
line Y = 0.1*X +1 vs. exponential Y = exp(0.7*X)
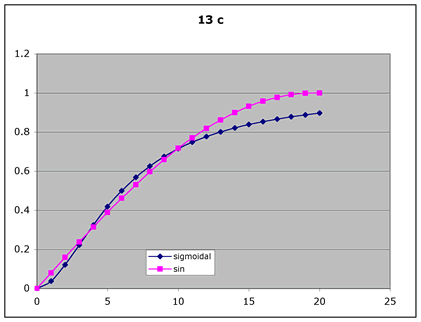
sigmoidal Y = X^1.8 / (X^1.8 + 6^1.8) vs. Y = sin(.08*X)
b. extrapolation
see above where simple errors would come from
c. hypotheses generation
compare the functions - is one more meaningful than the other?
in my own work: Productivity (P) (of algae) vs. incident light energy (E)
processes
light limitation then light saturation
Pmax and Ek
model name equation in Excel Blackman = MIN(E * Pmax/Ek , Pmax) Hyperbolic tangent = Pmax *TANH(E/ Ek) Saturating Hyperbola = Pmax * E / ( E + Ek) Poisson ( distribution of photons hitting a small target - link)
Ek is sites and E is events per time interval
= Pmax*POISSON(1, Ek/E, TRUE)
a. review
the log of a number is the power of ten that would give that number
log(10) = 1 --> 10^1 = 10
log (100) = 2 --> 10^2 = 100
log (1) = 0 --> 10^0 = 1other simple values
log(5) = .699
log (2) = .301
log (3) = .477
log (3.16) = .5 the square root of tenmultiplying numbers is the same as adding the logs
5 * 2 = 10
log(5) + log(2) = log(10)b. logs and ratios
if I multiply a number by 2 each time, it's like adding the log(2)
2*2 = 4
log(2) + log(2) = log(4)multiplying by this same ratio 5 times
2*2*2*2*2 = 2^5 = 32
5*log(2) = log(32)
each time I multiple by 2 the log of the result increases by the same amount (0.301)something increasing by a constant ratio (arithmetically) would be increasing linearly on a log scale
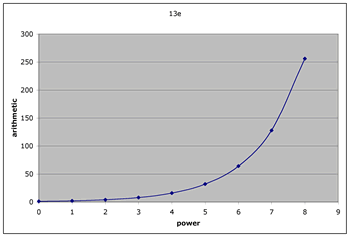
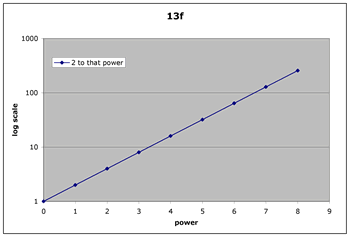
If you want to see if something is increasing by a constant ratio, plot it on a log scale. The slope will be the log of the ratio. For example in figure 13f, on the Y scale, 10 is 1 unit, 100 is 2 units and 1000 is 3 units. The slope of the line is 1 / 3.3 = 0.301
c. why this is important