Introduction
The purpose of this exercise is to take apart a model (in STELLA), to describe all the pieces and linkages, to describe what each part does on it's own, and then to describe the overall behavior. This skill will both let you help you see how a model is constructed out of simple parts and also how some unique features may be used.
In class I presented (lecture 14), how to link an equation to a behavior, and some of the parts of a model including open and closed structures, flow control and others. This exercise will draw on that material.
The "runoff" model should be on your desktop in the lab, but if it isn't, here is a link.
|
The "runoff" model
This is the same "runoff" model that you examined in ESR220 last term. You used it as a simulation to describe the behavior of the water. In this exercise, the focus will be on analyzing the parts. A simple description of the model function is:
when it rains water can go either into the ground or to runoff along the surface
if it rains less than 1 cm day, the water all goes into the ground
if it rains more that that, the excess goes off as surface runoff and directly into the stream
water that has traveled through the ground to get to a stream has been in contact with rocks and soil and has a higher conductivity
the conductivity of the stream depends on the relative amount of surface runoff vs. groundwater flow
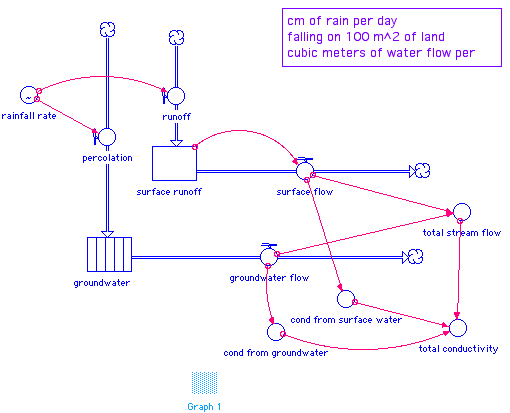
The model diagram looks like this:

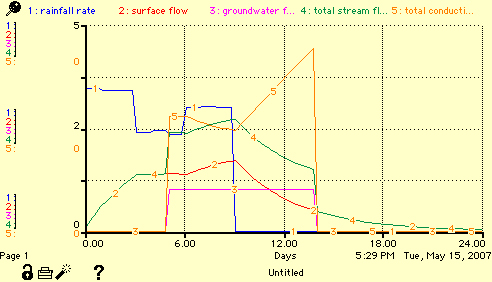
A typical graph of the output looks like this:

In addition to the standard STELLA icons and combinations (as discussed in class) there are two variations in this model.

|
This is a variation on a "converter" being used as an input table. If you double click on this or look in the equations page, you'll see that this is a table of rain input (cm/day) over the first 12 days.
You can change the input of rain per day by moving the slider bars in the histogram, or you can edit the values of the rain in the table.
|
 |
This is a variation of a stock (or reservoir) being used as a conveyor. If you double click on this, you'll get a dialog box that shows that it is is set so that it can accept up to 1 unit (of rain) per time and that it takes that unit of rain 5 days to travel through the stock then then be delivered. This is like a time-delay of 5 days from a little rain, to outflow increase. |
Equations page:
For reference, I have printed out the equations here. You should work on the model in STELLA so that you can check how the equations actually work.
groundwater(t) = groundwater(t - dt) + (percolation - groundwater_flow) * dt
INIT groundwater = 0
TRANSIT TIME = 5
INFLOW LIMIT = 1
CAPACITY = 5
INFLOWS:
percolation = if rainfall_rate < 1 then rainfall_rate else 1
OUTFLOWS:
groundwater_flow = CONVEYOR OUTFLOW
surface_runoff(t) = surface_runoff(t - dt) + (runoff - surface_flow) * dt
INIT surface_runoff = .5
INFLOWS:
runoff = if rainfall_rate <1 then 0 else (rainfall_rate-1)
OUTFLOWS:
surface_flow = .25*surface_runoff
cond_from_groundwater = groundwater_flow*.05
cond_from_surface_water = .01*surface_flow
total_conductivity = (cond_from_groundwater+cond_from_surface_water)/total_stream_flow
total_stream_flow = groundwater_flow+surface_flow
rainfall_rate = GRAPH(time)
(0.00, 3.48), (1.00, 3.43), (2.00, 3.43), (3.00, 2.40), (4.00, 2.45), (5.00, 2.35), (6.00, 3.00), (7.00, 3.03), (8.00, 3.00), (9.00, 0.00), (10.0, 0.00), (11.0, 0.00), (12.0, 0.00)
|
Description of Exercise
here are the steps and what should be written up (in italics)
1. Open the model. It should be on the desktop or on one of the shared drives.
2. run the model as a simulation several times to refresh your memory about the overall behavior.
open the rain input table and start with a simple event of 3 days of rain > 1 cm
make variations in the rain input and try to predict how all the parameters will change with time
do this until you are very comfortable about the overall behavior of the model and what each output parameter (i.e. the lines on the chart) represent
3. go through the model, component by component
be able to describe how each small chunk of the model works, just on its own
identify chunks of the model using the list discussed in lecture 14
describe how the different chunks work together to cause the output patterns
A. write up your description of each chunk, what equations are used, and how it would behave just on its own
4. Make a major change in the model
Propose a major change that you think might improve the model. This could be to increase realism by adding another factor or finer scale (such as hourly rainfall), or it could be to extend the model by adding another input or output (such as runoff from pavement, in addition to the groundwater)
make your proposed changes in the model and see if the output matches what you thought would happen
B. provide a diagram of your new model, a description of what change you made and why and an example output with comments on whether the behavior is what you expected.
|

