algae/ukl/aug-sep-04-report/work-summary.html
Summary of results
from work in August and September, 2004 in
Upper Klamath Lake
John Rueter
September 4, 2004
A. Purpose
During August and the beginning of September I did three pieces of work. First
I took multiple samples for total organic carbon analysis. Second, I made measurements
to compare the photosynthetic efficiency of cells from inside and outside the
limno-corrals. Third, I continued to explore the conditions under which humic
rich water will inhibit AFA photosynthesis.
B. Chemical characterization of humic rich water
Samples were collected on trips on July 27 and 28 and on August 23. These samples
were kept on ice and then refrigerated. About 50 mL was filtered through Whatman
GF/A filters using a syringe filtration system.40+ mL was used for TOC analysis
and the rest was used for absorbance and fluorescence measurements.
Thirteen samples were analyzed for DOC using a Shimadzu total carbon analyzer.
The samples were acidified prior to analysis. For a complete description of
the sampling sites and the Lat-Long coordinates please see sampling-sites.html
| # |
Sample site |
date |
comment |
TOC
mg/mL |
slope*
|
| 1 |
Moore Park Marina |
2004.08.23 |
|
26.31 |
-0.0133 |
| 2 |
Lower Klamath Marsh channel |
2004.08.23 |
|
33.42 |
-0.0133 |
| 3 |
Running Y Apple Tree |
2004.08.23 |
|
24.05 |
-0.0124 |
| 4 |
Running Y Golf Course channel |
2004.08.23 |
|
137.10 |
-0.0154 |
| 5 |
Shoal Water Bay |
2004.08.23 |
|
28.23 |
-0.0109 |
| 6 |
?Thompson Creek |
2004.08.23 |
not sure if this creek leads into Thompson Creek |
26.62 |
-0.0147 |
| 7 |
Wood River Marsh |
2004.08.23 |
|
52.15 |
-0.0140 |
| 8 |
Wood River Marsh |
2004.07.27 |
looks more muddy than brown |
45.20 |
-0.0149 |
| 9 |
Canoe Trail 1 |
2004.07.27 |
from under the Wocus plants |
|
-0.0139 |
| 10 |
Canoe Trail 2 |
2004.07.27 |
from open water in the trail |
24.60 |
-0.0141 |
| 11 |
Running Y Golf Course |
2004.07.27 |
|
139.10 |
-0.0183 |
| 12 |
Barley extract 1/1000 |
2004.07.27 |
|
7.39 |
-0.0133 |
| 13 |
Barley extract 1/100 |
2004.07.27 |
|
7.88 |
|
| |
Running Y canoe dock |
2004.09.01 |
afternoon |
|
|
| |
Running Y canoe dock |
2004.09.02 |
afternoon |
|
|
| |
Running Y canoe dock |
2004.09.02 |
evening |
|
|
* The "slope" is calculated as the decrease in the natural log
of the absorbance against the wavelength between 250 and 500 nm.
These samples were examined with both spectrophotometer and spectrofluorometer
analysis. I was trying to relate the total organic content and the little we
know about each of these water sources with absorbance or fluorescence characteristics
that have been shown to indicate particular processes.
The slope of the absorbance curve should indicate the photoreactivity. Lower
slopes indicate that relatively less of the higher shorter wavelengths are being
absorbed. I found a relationship between the total organic carbon and the slope
of the decrease in absorbance (Figure 1a. "slope-vs-toc.gif"). This
relationship implies that sources of water with higher organic content would
probably contain a smaller proportion of UV absorbing compounds, and thus are
likely to be less photoreactive. The highest point (28.23,-.109) is from Shoalwater
Bay. The sample came from a was from the outflow of a large marsh area and was
highly turbid with mud. The high turbidity could have protected the organics
from degradation.
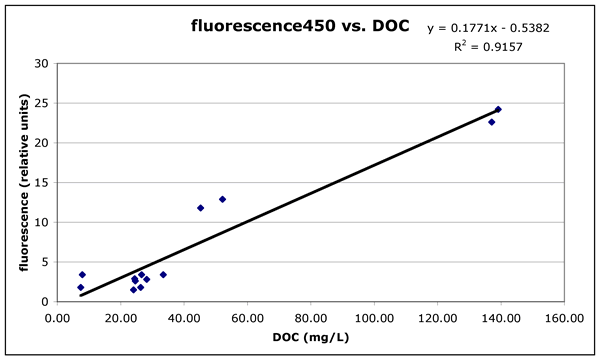
The UV absorbance at 250 nm (Figure 1c) and the fluorescence emission at 450
nm with excitation at 370 nm (Figure 1c) were both related to the dissolved
organic carbon. These indicators could be used as rapid estimates for the amount
of dissolved organic carbon. We still need a spectral or fluorescence signature
that could be used to track or identify active humic water.
Figure 1 ("slope-vs-toc.gif"). The slope of the decrease in absorbance
with wavelength plotted in relation to the total organic carbon concentrations.
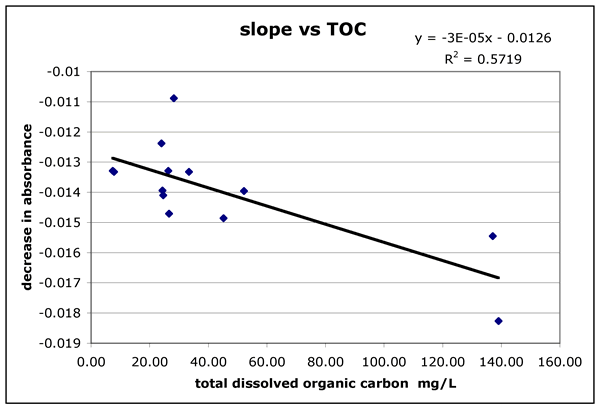
Figure 1b ("abs250-vs-DOC.gif"). Absorbance of the filtered water
at 250 nm.
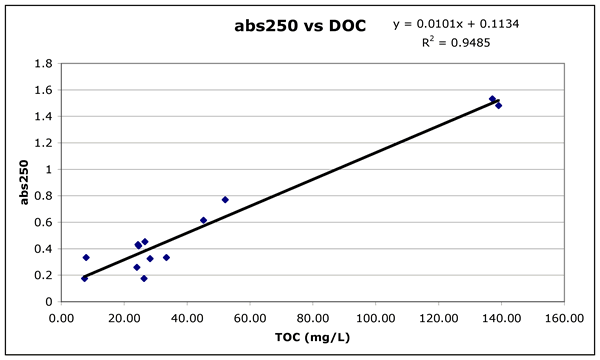
Figure 1c ("fluor450-vs-DOC.gif"). Fluorescence for excitation
at 350 nm and emission at 470 nm.
C. Photosynthetic efficiency in the limno-corral environment
Photosynthesis response curves of light vs. ETR were run on samples collected
from inside and outside the limno-corrals. Samples were taken in the morning
and in the mid-afternoon just as the wind had built up. The afternoon sample
was timed to determine if the AFA in ambient water was more mixed than those
in the bags.
Figures 2a and 2b ("in-and-out-morning.gif" and "in-and-out-afternoon.gif").
ETR light curves measured by PAM fluorometery. ETR is related to other photosynthetic
measurements such as oxygen production or 14C fixation. All but four points
on these graphs represents the mean of two readings on two separate samples
taken from either the lake or the limno-corral. There are four points at high
light for the "IN" samples for the morning comparison where there
are only duplicate readings of individual samples at 800, 1000, 1200, 1500,
and 1600 uE m^-2 s^-1.
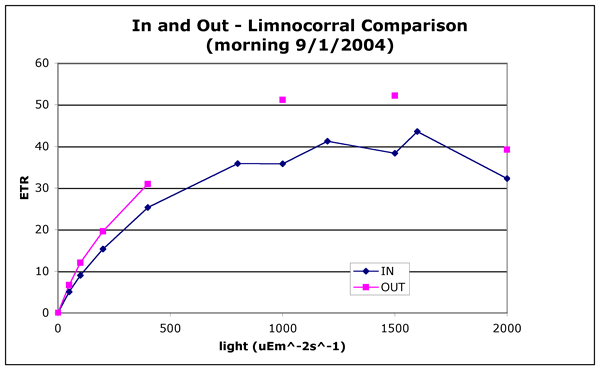
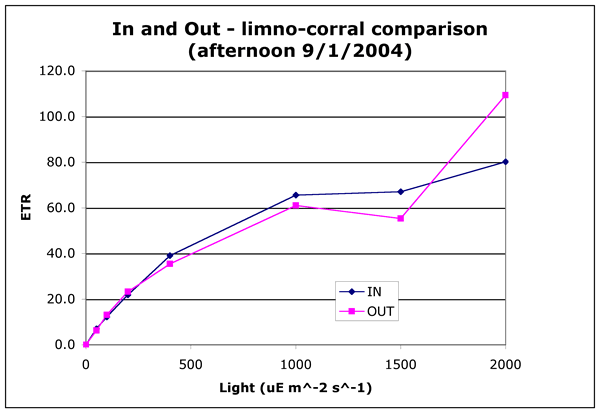
These differences in photosynthetic efficiency are minor and could be explained
by a small (20%) difference in the cell count. The important result is that
the cells in the limno-corrals were healthy and had high photosynthetic efficiencies.
This indicates that there was no severe limitation by light or nutrients.
D. Inhibition of AFA by humics and light
The potential inhibitory effect of humic rich water was tested by mixing filtered
humic rich water with a healthy sample of AFA. In each run of this experiment,
six conditions were run:
"E" 1/2 AFA source water + 1/2 filtered AFA source water
"F" 1/2 AFA source water + 1/2 filtered humic source water
"R" raw, undiluted, AFA source water
In each case cells were either left in the dark or exposed to natural sunlight.
Cells that were left in the dark were denoted by a "-". After exposure,
all the samples were sampled over a time course, looking for the level of inhibition
and potential recovery of the Fv/Fm ratio.
Figure 3 ("inhibition-run1.gif"). Inhibition experiment run1, Sept1-04.
Algae were collected from the limno-corral site. The brown water was collected
from the canoe dock on the Running Y resort. The incubation took place from
4:30 PM to 5:04 PM. The PAR was not measured. The UV dose was 82.8 uE m^-2
s^-1 of UV (UVA and UVB). Each point in this graph is the mean of four readings
on a single sample.
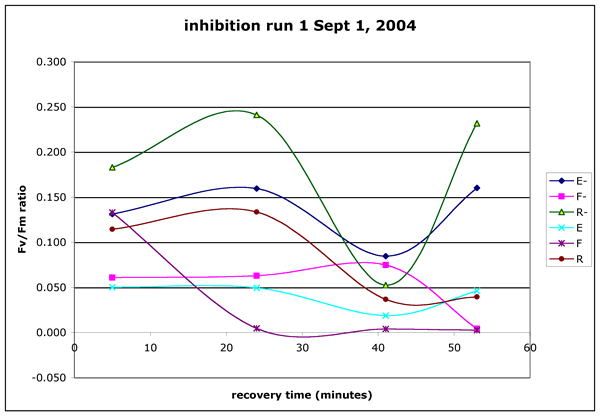
Figure 4 ("inhibition-run2.gif"). Inhibition experiment run2, Sept.
02, 2004. Algae were collected from the limno-corral site. The brown water
was collected from the canoe dock on the Running Y resort. The samples were
exposed to light for 21 minutes from 14:29 to 14:50.. The PAR dose averaged
1609 uE m^-2 s^-1. The UV dose was 106 uE m^-2 s^-1 of UV (UVA and UVB). The
non-exposed points are the mean of four readings on a single sample at each
time point. The light exposed points represent the mean of two separate samples
with four readings on each sample.
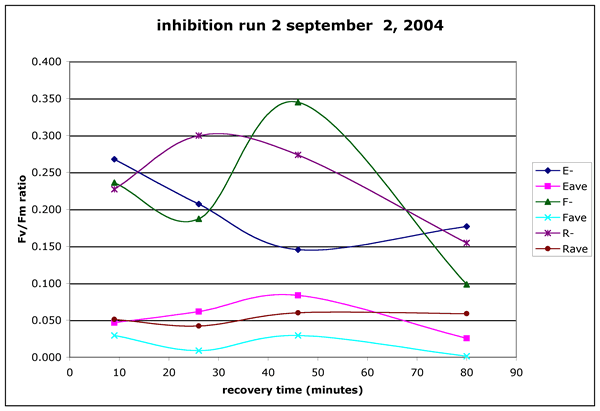
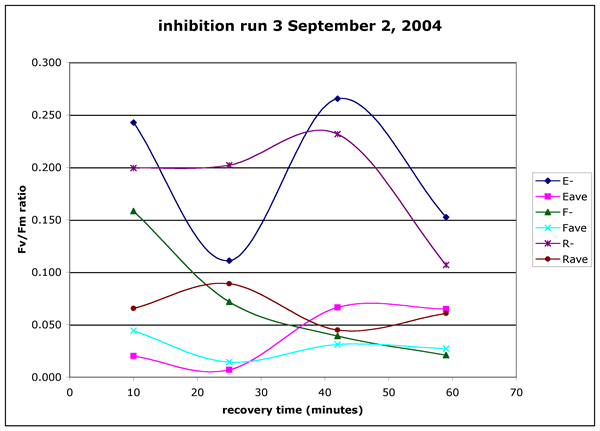
Figure 5 ("inhibition-run3.gif"). Inhibition experiment run3, Sept.
02, 2004. Algae were collected from the boat ramp by the apple tree at the
Running Y resort. The brown water was collected from the canoe dock on the
Running Y resort. The samples were exposed to light for 10 minutes from 17:50
to 16:00.. The PAR dose averaged 610.8 uE m^-2 s^-1. The UV dose was 46.9
uE m^-2 s^-1 of UV (UVA and UVB). The non-exposed points are the mean of four
readings on a single sample at each time point. The light exposed points represent
the mean of two separate samples with four readings on each sample.
These inhibition experiments show definite inhibition of cells by light treatment,
dilution and mixture with filtered brown water. Without further work, I can't
be definitive about the statistical significance of these data however it is
clear that the mixture of algae with humic rich water had a detrimental effect.
In run 1 (Figure 3) the humic mixture "F" had a dramatic and unrecoverable
inhibition. In run 2 (Figure 4) all exposed cells had much lower Fv/Fm ratios
but the humic addition caused the most severe limitation. In run 3 (Figure 5)
the humic addition had the lowest average Fv/Fm ratio and, importantly showed
the least sign of recovery. In run 3 (and to a lesser extent in the other two
runs) the addition of humics had a inhibitory effect even on the samples kept
in the dark. This effect may be particularly important in the application of
this to real mixing scenarios where the PAR and UV doses would be very small
except for at the very top of the water column.
D. Summary comments on August and September work
This work had three major results:
1. It would be difficult to identify reactive humic waters give the absorbance
and fluorescence measurements that I am able to take. Maybe concentrated humics
samples (from Mike Perdue) could be used in inhibition tests.
2. The cells in the limno-corrals seem to be as healthy (in terms of photosynthetic
response) as the cells in the surrounding lake. The similarity between the corrals
and the lake also would indicate that the cells in the bag were not light or
nutrient limited. In order to really make the claim it is probably important
to make sure that the water in the bag is not exchanging with the water in the
lake. We could use a non-toxic conservative tracer in the bags.
3. The work over the last month helped clarify the value of the PAM fluorometer
in these studies. It turned out that the dilution and light exposure regimes
used were to "heavy handed". More work should be done that explores
lower humic contributions (in the range up to 10% of the total rather than 50%)
and lower light exposures. Dilutions and light exposures in these ranges are
much more realistic for humic inputs during the spring.


