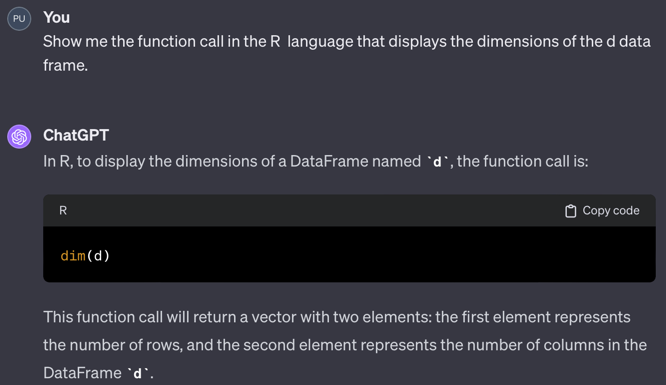
d data frame: dim(d).If you are reading the web version of this document and you prefer Dark Mode, click on the slider button in the top-right corner.
Data analysis only occurs when computers do the computations. Developing the instructions to perform the analysis requires a language for specifying the instructions, the code, and a development environment from which to enter and run the code. The following languages for data analysis are those you are most likely to encounter in the workplace. Each of these languages accomplishes an analysis by calling one or more functions. Each language is sufficiently robust for most applications, with the newer languages offering additional advantages, though without the large-scale adoption of the classics, R and Python.
Generative AI apps such as ChatGPT can write code in any of these languages. ChatGPT, beginning with Version 4, can also run the Python code it generates. Here, use ChatGPT to generate a single function call to display the size of a data frame (table) for each of the open source languages. For Python, ChatGPT4 ran the code and displayed the results. Of course, these code snippets only apply after the data has been read into a data frame.
The examples presented here are of the simplest possible code, a single function call. In general, ChatGPT can write programs in any of these languages that consist of tens of lines of code, all generated from simple prompts of only one or several sentences. When running its created Python code, ChatGPT generates both text output and data visualizations.
The data analysis programming language R was the first comprehensive open-source, free data analysis programming language. Developed in the mid-90s, R reached Version 1.0 in February of 2000. Most R users write R code and do data analysis in the RStudio environment. The analysis is with R but within an environment that provides many advantages for developed and running R programs.
Core statistical analysis and data management capabilities are built into what is called Base R, the version of R downloaded from the worldwide network of R servers. R organizes its data manipulation and analysis functions by a set of related functions called a package. The R statistics functions are in the stat package, the graphics functions in the graphics package, etc. Moreover, R is extensible. Anyone can contribute to the R ecosystem, such as with my lessR package, by creating and uploading packages of functions to the public R servers that pass stringent quality control checks. Analysts can selectively download contributed packages, seamlessly integrated into the R environment. The R examples presented later in the course include function calls from Base R, lessR, and from another package called the Tidyverse.
d data frame: dim(d).Named after Monte Python’s Flying Circus, the British comedy series from the 70s and 80s, Python was developed by Dutch computer scientist Guido van Rossum around 1990. Python has now become one of the most popular general-purpose programming languages. Whereas R focuses on core statistics and data analysis concepts, Python is a general programming language developed without any reference to statistics and data analysis. Fortunately, Python is also extensible, so all the data analysis capabilities of Python are provided by packages added to the core Python language.
Python is available from many sources, including its official source at python.org, which does not include data analysis routines. A straightforward way to run on your computer is to download the Anaconda distribution from Continuum Analytics. The Anaconda distribution includes not only Python per se but many popular packages installed with the installation.
Installed packages include those developed for statistics and data analysis. All data analysis with Python is done with add-on packages, called modules in relation to Python, such as Pandas for basic data manipulation and analysis with data structures such as the data frame. Another popular add-on package is sk-learn for machine learning. Most data analysis code relies little upon actual Python code but instead runs code from additional packages such as these. Python for data analysis was not practical until Pandas appeared in 2008 and sk-learn appeared in 2007. Version 1.0 of Pandas was not available until January, 2020.
Python code can be developed within many programming environments, of which Jupyter Notebooks is a popular option. A notebook is organized by cells, where each cell is a code block or explanatory text. Run the code cell-by-cell, either one at a time or all at once.
Although Python statistics and data analysis capabilities followed those of R, Python machine learning developed ahead of R’s capability with sk-learn. Although R has now caught up, Python has become the established standard for machine learning. Another Python advantage is that learning to code with Python is learning to code with a standard computer programming language.
In the following example of ChatGPT, with at least Version 4, writing and then running the Pandas code for obtaining the dimensions or shape of a data frame, ChatGPT also interprets the output. Of course, the data table with 37 rows and 9 columns was previously uploaded to ChatGPT before obtaining the dimensions.
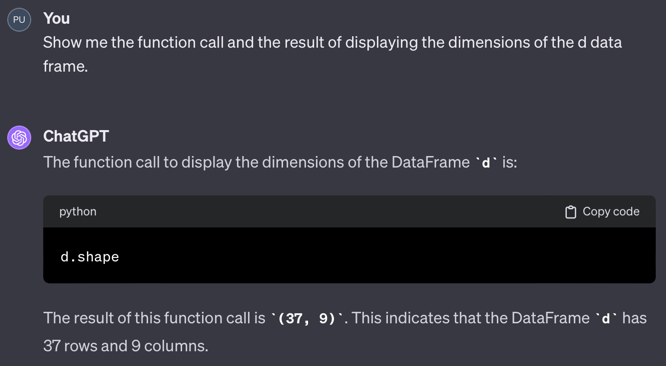
d data frame: d.shape.R and Python are now integrated. From within RStudio, with the reticulate package, it is easy to mix R and Python code together in the same code file, or even program with just Python code within RStudio. There is no need to use Jupyter Notebook for developing and running Python code unless desired.
Although there are some conceptual differences, R and Python code basically work the same with related syntax. The Python Pandas data analysis package was deliberately modeled after R data analytic functions and terminology. The syntactical differences are of increasingly less relevance given web look up and generative AI that can write code in R and Python and others as well. What is important is not memorizing syntax but learning data analysis concepts.
Usually R code is developed in the RStudio environment and Python code developed in the Jupyter Notebook or related environment, but both systems work in both environments. Doing Python in RStudio is as easy as doing R in RStudio, with the added benefit of the quarto document preparation system that interweaves analysis output with written, free-flowing descriptive text video [23:26]. Your document is simultaneously a word processing document and a computer program. Click the Render button and you have a web page, MS Word doc, or a pdf document complete with your writing and analysis output.
Furthering this integration of the two primary data science languages, the creator of Pandas, Wes McKinney, has recently joined the RStudio company, now called Posit. As written on the Posit web site, “When we changed our name to Posit our hope was to unify efforts around creating great tools for data science, regardless of language, and working with Wes is a huge step forward in realizing that dream.”
Central to the interoperability of different data science languages is data storage that is language and platform independent. For example, every data science language has at least one function for reading data stored as an Excel file. There are multiple data formats beyond Excel that store data able to easily be accessed by any data analysis language. Excel is only appropriate for small to somewhat medium size data files.
Larger data files should be written in language and platform independent format optimized for big data. Here, again, the collaboration has benefited the data science community. One of the best data file formats available in multiple languages is feather, initially a joint effort between Wes McKinney of Panda’s fame and Hadley Wickham, the chief data scientist at Posit, formally the RStudio company. We further discuss this format in a later document.
The emergence of powerful, comprehensive data science software began in the early 1970s with two commercial (cost $) implementations: SAS (for Statistical Analysis System) and SPSS (Statistical Package for the Social Sciences). IBM acquired SPSS in 2009, so it has substantial financial backing and marketing. Throughout the last quarter of the 20th century, statisticians considered SAS the premier data analytic system. Indeed, I used SAS 1.0 around 1972 and then through multiple versions until 2008, when I switched to R. SPSS was likely the most popular analysis system during that pre-R period because it was perceived, not entirely correctly, that it was easier to use than SAS. Both systems comprised the primary analytic systems during that time.
These systems are mentioned here because they continue to be found in contemporary businesses. Start-ups generally do not adopt these commercial systems, but many established companies retain the extensive implementations and in-house expertise for the systems they have been running for decades. SAS and SPSS are as powerful and comprehensive as R and Python but expensive even for a single license.
A promising, new open-source data science language is Julia, developed to improve upon Python. The Python language was not created as a data science language and, as such, is not as fast as it could be for doing data analytics. Given Python, Julia was designed to be as easy to use but faster and more efficient. A good choice for a new data science student would be Julia over Python in an ideal world. But the world is not ideal. Julia does not have the large number of external packages that Python or R have, nor anywhere near the number of users and support possibilities. That said, its developers successfully created an incredibly fast and easy to use modern data science analysis language. Julia code can also be developed in the same Jupyter Notebook environment originally designed for Python.
Realizing the need to ease the transition between languages, Julia can transform Julia programs into Python programs. A Julia data analyst can work with a Python analysis team, develop in Julia, and share Python code with other team members as needed. Julia can also access Python libraries if no Julia alternative yet exists. Of course, Julia’s speed advantage is lost in the transition.
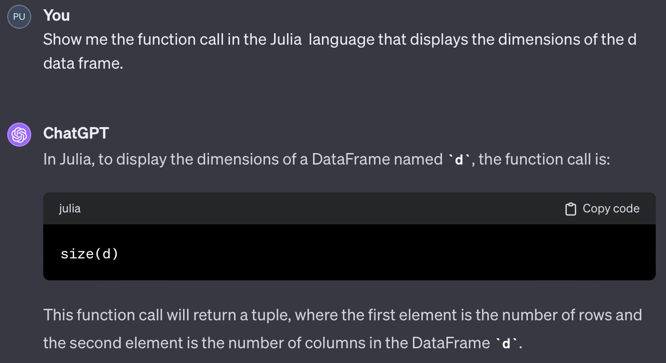
d data frame: size(d).Rust, a language developed relatively recently, emerges as a promising contender in the data science arena. Its primary objective is to offer unparalleled speed and security, fortifying against vulnerabilities that could lead to cyber attacks and compromise computer security. Rust encourages programming practices that enhance efficiency and produce clean, maintainable code, thereby minimizing the risk of obscure bugs in data science systems. This results in dependable, robust code. Mirroring Julia’s adaptability, Rust also seamlessly integrates into the Jupyter Notebook environment, an ecosystem originally tailored for Python. This compatibility underscores Rust’s potential as a versatile and powerful tool in data science applications.
A Rust downside is a steep learning curve to begin programming in the language, partly because the overall strategy is to minimize programming errors. It imposes a tight structure with comparable code that can be more verbose than that obtained in other languages. For example, Rust requires the programmer to explicitly declare the type of storage for each variable and to track memory usage explicitly as a program runs. Languages such as R and Python implicitly and automatically accomplish these tasks. Also, like Julia, because the language is relatively new, it is more difficult for an organization to adopt Rust without the vast Python support ecosystem and external packages and analysts already familiar with a more established language.
Advanced data science companies no less than Google and Meta (Facebook) have adopted Rust as one of their core data science languages. For my personal experience, although not a Rust programmer, I have talked with an accomplished Portland area data science programmer with years of experience who now enthusiastically does all of his programming in Rust. He is convinced that the primarily resulting error-free, secure code from the overhead structure imposed by Rust is well worth the learning curve to become proficient in the language. Moreover, Portland has become a center of Rust development. The Portland Rust users group, PDX Rust, has 702 members as of December, 2023.
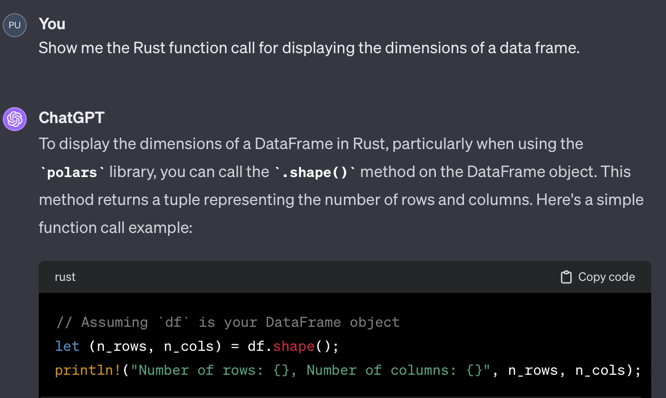
d data frame.One reason Rust achieves such a fast run time speed is that its data are stored in data frames according to a language-independent, highly optimized data system called Apache Arrow. Languages such as R and Pandas 1.0 interface with Arrow via external packages that must convert data to and from R or Pandas data frames and Arrow data structures. Direct access to this storage medium facilitates speed, and the resulting Rust data is directly accessible by the other languages with their provided packages.
Arrow is becoming increasingly important in data science. Pandas is built on numpy for its mathematical underpinnings. More recently, two new corresponding packages have been released that seek to update classic Pandas through Version 1 by using Arrow as the basis for the underlying mathematics. One advance is Pandas 2.0, first released in April of 2023. A second development is Polars, designed from the beginning to be fast and efficient for data manipulations especially for large data sets, big data, and programmed completely in Rust. Essentially, Polars is an extension of Rust that relies upon its native speed and parallelism, the ability to simultaneously use multiple cores of a CPU. Moreover, Polars and Pandas data frames are interchangeable, facilitating the integration of the two systems.
As these new, improved systems are increasingly adopted over Pandas 1, look for less standardization in the future. Some people will be using the first version of Pandas, others will move to version two, and others will move to Polars. Still, the basic functionality and data interchangeability of these systems remain. Today, both Pandas 2 and Polars are both considerably faster than the current standard, Pandas 1, with Polars the current speed winner.
All the languages described above support serious data science with corresponding development environments. However, even though R and Python are free downloads for a single user, corporate options incur costs to obtain collaboration and server options with priority support options. Basically, installing collaborative data analytics software will cost money, regardless if open source software or not. For example, the company that develops RStudio and provides a free single-user license, Posit, needs to pay its employees and maintain servers for cloud computing. Beyond the limited 25 minutes of free cloud computing per month, the user must pay some of the cost of cloud computing. Beyond the free download of RStudio Desktop, Posit charges $995 a year for RStudio Desktop Pro. The bottom line is that corporate computing typically costs at least some money, regardless of the free options offered.
The software described accomplishes basic data manipulation and cleaning and then analysis of that transformed data. This analysis software is usually only one component of the software ecosystem needed to supply a complete data science solution that involves the construction of data pipelines that structure the flow of data from collection through analysis, what are called ETL systems, for the Extraction, Transformation, and Loading of data for analysis. These data pipelines involve data bases and data storage and retrieval software such as SQL and Apache Hadoop. Data pipelines are often tied to cloud-based systems offered by companies such as Amazon, Microsoft, and Google, which respectively offer their own data management software: AWS Data Pipeline, Azure Data Factory, and Google Cloud Dataflow. Many other companies offer their own ETL software. Open source solutions such as Apache NiFi are available as well. That said, accomplish the data analysis per se with the software described above.
Ultimately, the general concepts of using data analysis software, not the specific syntax, are essential to learn. For example, understand that data is conceptualized as a rectangular table called a data frame with each column of data storing the data values for a single variable. A property of that table is the number of rows and columns. The above code snippets show that the syntax for obtaining those dimensions varies across languages. Still, a specific syntax is quickly retrieved from either a web search or a chatbot. Once the underlying concept is understood, retrieving the specific function call from any language becomes quick and trivial. This simple example extends to all standard operations data analysts perform on data tables.