Correlation Analysis
RQ3: Independently of how groups are organized, is age related to how people evaluate the results of group projects? E.g., do older, as people grow older and gain life experiences, do they get better at working in groups?
There are two ways age could be related to evaluations. If the relationship is positive, the older a student is, the more highly that student will evaluate the results of group projects. If the relationship is negative, the older a student is, the less highly the student will evaluate the results of group projects.
A convenient and widely-used statistic for expressing the relationship between two variables is the coefficient of correlation. If both variables are at least interval-level variables, we use the Pearson's coefficient of correlation. If either variable is ordinal-level, we use the Spearman's rank-order correlation. For this example, I will use Pearson's coefficient of correlation, which can be easily calculated using Excel. Spss will calculate either coefficient: Consult the discussion of how to compute correlation coefficients in Spss.
The coefficient of correlation ranges from -1 to +1. A coefficient of -1 means that the two variables are perfectly negatively correlated: If age and evaluation are correlated at r = -1, each unit of increase in age will be associated with a decrease in evaluation. A coefficient of +1 means that the two variables are perfectly positively correlated: If age and evaluation are correlated at r = 1 (the + is always omitted), each unit of increase in age will be associated in an increase in evaluation. A coefficient of 0 means that the two variables are not correlated at all: An increase in age is equally likely to be associated with either an increase or a decrease in evaluation.
If a coefficient of correlation is very near zero, a random fluctuation in even one response can change a coefficient of correlation from a small negative value to a small positive value. Therefore, as correlation coefficients approach zero, very small coefficients are increasingly difficult to distinguish from zero. The larger the sample, the less likely it is that random fluctuations in a small number of responses will make much of a difference. Consequently, the size of correlation required before we should consider a coefficient to be different from zero increases as the size of the sample gets smaller. See the discussion on sampling.

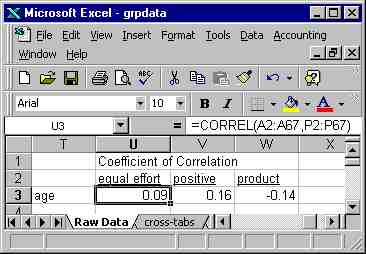
To compute a coefficient of correlation using Excel, go to a blank part
of the worksheet and set up a correlation table, as shown in the illustration
below and to the right.
Place the cursor in the first cell, then click on the f(x) symbol at
the top. On the drop-down menu, click on "statistical," then on "correl"
(short for correlation). You may then either enter the column and
rows for the first array (the variable age in this case) manually, or highlight
it with the cursor and let Excel enter it automatically. Repeat for
the second array (eqeffrt in this case). Excel will then calculate
a coefficient of correlation for those two variables.
Repeat the process for the other two variables, and you have the correlations between age and evaluation of group projects.
All three correlations in this example are quite small. With a
sample this small, it would take very little random fluctuation to change
the coefficients from positive to negative, or from negative to positive.
(I wouldn't get very excited about a correlation coefficient below about
.30.)
Accordingly, I will conclude that my data do not support the conclusion
that there is any correlation between age and evaluation.
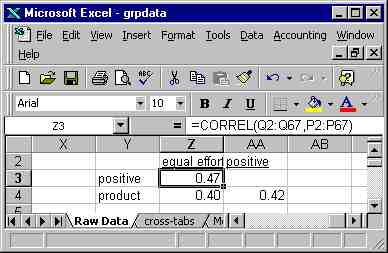
By way of illustration, I also had Excel calculate the coefficients
of correlation among the three evaluation variables. These are all
quite respectable (although not by any means large). I can conclude
that a high evaluation on any one aspect of group projects is positively
related to a high evaluation on any of the three aspects of group
projects.
Communication Studies Mainpage
![]() (PSU
Home Page)
(PSU
Home Page)
This page is maintained by David Ritchie, e-mail:
cgrd@odin.cc.pdx.edu
Last updated on July 29, 1999.