Your Project Proposal is your
midterm!
It is worth 15% of the grade for
this class.
This is your chance to tell me
what you've learned about GIS
You have been assigned chapters to
read. Instead of an in-class or take-home midterm, you will fold this
information into your project proposal. The format is to convince a
manager or agency to fund your analysis of this problem using GIS. They
need to be educated on what GIS is, how it is different from other
methods of analysis, and how you will use it solve your problem.
Your proposal should include elements
from various chapters, including:
- Purpose of this GIS project and how it
compares to other GIS purposes.
- Model of data you will use (raster,
vector or both), objects types, measurement scales (nominal,
ratio, etc), what type of attribute data you will have, etc.
- Sources of data: projections,
conversions, scale (why does scale matter?). Is all of the data
available in a georeferenced format already? If not how will you
georeference it? What other data could you use? How would you
georeference it? Scanning? Digitizing?
- Analysis of data: some type of analysis
should be performed, there are plenty of examples in the later chapters.
Be sure to justify your choices in each
case, ie raster vs vector... Don't just say "I'm using vector data"!
Your proposal should also include some
background information on the problem, ie Why is this important?
This will be re-used in your final report, so it is time well spent!
Conciseness and clarity are crucial in
this type of write-up. You've easily got 3-4 pages of material here (I
think...), I would imagine going no higher than 10 pages if you have a
lot of graphics. In general I am impressed less with bulk and more
with clarity.
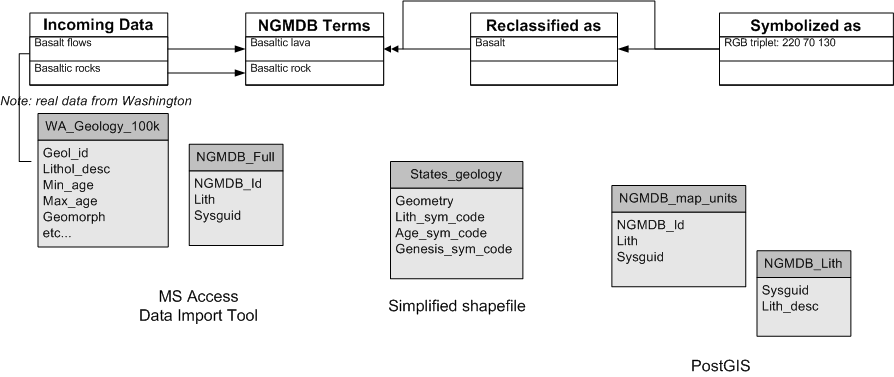
It has been noted
that diagrams can help a lot. Here's an example.
Have fun, don't stress out...
Here are some potential group projects:
Water Resources and receding glaciers:
Breeding
Bird Survey (combine with LULC and NLCD)
Glacier database - Predict glacier
occurence from topography (elevation, slope and aspect) and climate
data using Logistic
Regression, glacier data here,
climate data here. Use
random generated points within study area, attribute each with whether
it falls within a glacier or not (1 or 0), multiple linear regression
within Excel to determine coefficients for each variable (precip, temp,
elevation, aspect), multiply rasters by coefficients and run through
equation in PPT.
Carbon Sequestration: Stratigraphic
units have different ability to act as CO2 sink. Plot distributions of
viable candidates with regard to CO2 sources, and transportation
corridors.
Geothermal in Alaska predicted by
geochemical and geophysical properties. Data layers.
Water Quality data in the Metro Region.
10 year study of SWRP data
vs urban change data
Coastal cores, loess distribution and
shelf thickness.
NEW:
Rattlesnake Tuff -- plot outcrop locations and data. Analyze
relationship of tuff thickness, elevation, and distance from eruptive
vent.
NEW: Thin
section analysis -- Overlay digitized grain boundaries on a thin
section, build geodatabase of attributes. Analyze ~10 layers of
elemental chemistry from microprobe (raster data).