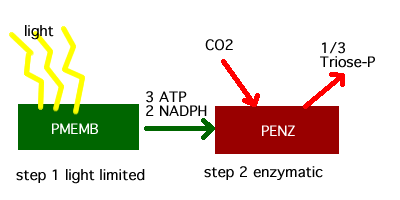
Figure 1. The two steps in photosynthesis.
algae/notes/optimization
Optimization is the outcome of cellular acclimitization and regulation processes that change the relative composition of cellular components to provide the maximum specific growth rate at given conditions and resource levels.
In the simplest example, cells change their composition to provide the maximum flow rate of carbon (or equivalent energy or nitrogen) through all the cellular components. If any component is limiting the flow rate, material from other non-limiting components can be reduced and invested in the limiting component until the flow rate is equalized.
Shuter, Brian. 1979. A Model of Physiological Adaptation in Unicellular Algae. J. theor. Biol. 78: 519-552.
The serial steps in photosynthesis, first the transduction of light energy to chemical energy and second the fixation of CO2 to triose-P is a good example of the principles behind optimization.
Figure 1. The two steps in photosynthesis.
Step 1: Light-dependent tranduction of energy by the photosynthetic membranes PMEMB.
At saturating light the molecular efficiency of PMEMB is about 1 mol carbon fixed per mol carbon in PMEMB per hour.
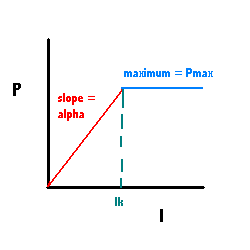
A simple model for light-dependency is the Blackman model that has two paramters Ik and Pmax.
Figure 2. Light dependency of PMEMB.
Ik = 100 umol photons m^-2 s^-1.
Pmemb = 1 mol C (mol C in PMEMB)^-1 hr^-1.
Step 2: The chemical energy provided by step 1 is used to fix carbon dioxide into triose-P.
The molecular efficiency for PENZ is 1 mol C (mol C in PENZ)^-1 hr^-1.
The maxiumum molecular efficiencies of both steps are equivalent, however PMEMB can be limited if the light flux is under 100 umol photons m^-2 s^-1. Under low light, algae will optimize their use of cellular material by adjusting the relative composition of PMEMB and PENZ. This optimization yields the fastest possible serial flow for both steps. If either step is limiting, the ratio can be adjusted to put more material into the limiting step and less in the other component. How the cells readjust their composition is dealt with in the sections on dynamic regulation of cell composition and acclimitization strategies.
The following calculations are based on optimizing the flow in the following four equations:
PMEMB_potential_rate = if (light <100, then PMEMB_quantity * Light/100, else PMEMB * (100/100))
PENZ_potential_rate = PENZ_quantity * 1 (mol/(mol*hr))
PMEMB + PENZ = total carbon in the photosynthetic machinery
serial_flow = MIN(PMEMB_potential_rate, PENZ_potential_flow)
The examples will illustrate that this is easier than it looks above.
Table 1: example calculations at 5 light intensities given a limit of 1 mol of C to split between
LIGHT PMEMB PENZ optimized flow 100 (or above) 0.50 (1/1) 0.50 (1/1) 0.50 75 0.57 (4/7) 0.43 (3/7) 0.43 50 0.66 (2/3) 0.34 (1/3) 0.34 20 0.84 (5/6) 0.16 (1/6) 0.16 10 .91 (10/11) .09 (1/11) 0.09 0 ? ? 0.00 The simple algorithm for solving these optimization problems is that the ratio of PMEMB/PENZ compensates for the % light limitation. For example light=50 represents a 1/2 limitation of the light machinery which is compensated by a 2:1 ratio of light machinery to enzymatic machinery. A 2:1 ratio of PMEMB to PENZ means that the carbon invested is split into 3 portions; 2 of the three portions go to PMEMB and 1 of the three portions goes to PENZ.
Because the molecular efficiency of the PENZ is 1, the optimized flow will equal the value of the quantity of PENZ.
The readjustment of each the composition for each light level generates a set of optimized values that represent the potential of an acclimated population of alge, NOT the potential rate of any particular algae as it sees different light.
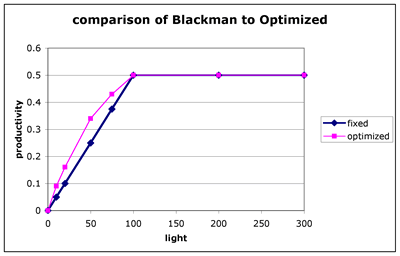
Figure 3. Comparison of photosynthetic rate between populations of algae that do not acclimate compared to populations that are acclimated to each light level. The Blackman model is calculate for 50:50 ratio between PMEMB and PENZ. NOTE: this is not a P vs. E curve for any particular algae unless they could acclimate instantaneously.
Algae that are acclimated to a light level of 50 perform about 1.4 times as well as a population that had a fixed 50:50 composition (i.e. acclimated to saturating light.) Although it is difficult to see in the figure, the cells at a light level of 10, performed even better than this. Acclimated cells at 10 did 1.8 times as well as non-acclimated cells.
An important aspect of acclimization is that the response to increased (or decreased light) is non-linear. Increasing the light level results in a less-than-linear increase in productivity. For example, starting from a light level of 10 and doubling the light, results in an increase from 0.09 to 0.16 (not quite a doubling). In the non-adapted cells, the increase is exactly double, going from 0.05 to 0.10. This is even more evident near saturation, in acclimated cells going from 50 to 100 only increases the productivity from 0.43 to 0.50. Conversely, when the light level is decreased there is a compensation in the machinery that decreases the potential loss of rate. Of course, diminishing returns for light increase is the same as better than linear performance when light is decreased.
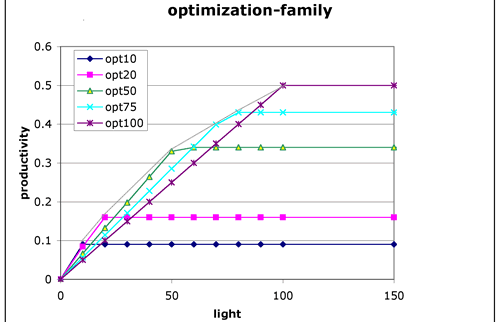
Any particular cell can only be acclimated to one light level at one time. If individual cells are exposed to a range of light their performance will depend on their physiological composition. Cells that are acclimated to low light will do better at low light but saturate at a very low light level. Cells that are adapted to high light will saturate at a faster rate, but will underperform at low light. This can be seen as a family of curves for different cell compositions. The break points in each curve represents an envelope of the highest possible potential rates for that population under different cellular compositions.
Figure 4. Family of curves for different cellular compositions. The light grey line gives the envelope of maximum performance under different acclimitization strategies.
Expanding this treatment to all of the active components of the cell is conceptually straightforward for steady environmental conditions. For light limited cells, the only other component that we need to consider is the ENZ. The composition of the cell's structure, nitrogen assimilation machinery (assumed to be saturated) will be constant and the amount of cellular reserves will be unimportant in constant light.
Below, we will calculate one simple example for cells growing under a light of 10 vs. 100 and for a total cell composition of 10. The cell structure will be set to be 2 the NASSIM and RES will be ignored at this time.
PMEMB_potential_rate = same as above
PENZ_potential_rate = same as above
ENZ_potential_rate = ENZ_amount * 0.17 (this is the least efficient component in the cell)
STRUCT = 2
PMEMB_amount + PENZ_amount + ENZ_amount + STRUCT_amount = 10
overall_flow_rate = MIN(PMEMB_potential_rate, PENZ_potential_rate, ENZ_potential_rate)
Without going through the algebra ...
at light = 100
PMEMB_amount = PENZ_amount = 1/6*ENZ_amount
these components need to be split up between 8 units of carbon (10 - structure)
which solves (amazingly) to
PMEMB_amount =1
PENZ_amount=1
ENZ_amount = 6
at light = 10
1/10 * PMEMB_amount = PENZ_amount = 1/6*ENZ_amount
these components need to be split up between 8 units of carbon (10 - structure)
which solves (a bit more complicated operation) to
PMEMB_amount =10 "parts" = 0.6 * 8 =4.8
PENZ_amount= 1 "part" = 0.59*8 = .47
ENZ_amount = 6 "parts" = 0.35*8 = 2.8
each part = 1/17 * 8
Optimization of the cellular composition results in the cells ability to handle limited resource availabilty. Decreasing resource availability reduces the net output by less than a linear decrease. Conversely, increaseing the resource has a diminishing return the process. A major constraint on the maximum metabolic rate in cells is the heavy investment needed in the very inefficiency enzymatic and biosynthetic machinery.
accompanying Excel Worksheet = optimization.xls
John Rueter
ESR473
2003.04.08