Lecture 16
Correlation and
Causation
I'd like to make a few comments
about correlation and causation. It is often said that a correlation between
two variables does not imply causation. This is generally true. Just because
the amount of time spent working on an exam is positively correlated with the
grade on the exam does not mean that spending more time on an exam will
necessarily lead to a better grade. The two might be correlated for some other
reason.
In some instances, the adage about
correlation and causation is actually not true. Consider the situation in which
we have a well conducted experiment that compares two groups. We compute a
correlation coefficient and there is a significant relationship between the
experimental variable (i.e., group membership) and the dependent variable. This
would, of course, be the same as conducting a t-test. Assuming we have
eliminated any confounds and we used random assignment, we should be able to
conclude that the independent variable caused the dependent variable. So in
this case a correlation between the independent variable and the dependent
variable indicates that the independent variable caused the dependent variable.
If a non-experimental study is
conducted, there is likely to be some alternative explanations for a
relationship between the independent and the dependent variable, because we did
not randomly assign participants to experimental conditions.
A Couple of Common
Alternative Explanations for a Correlation Between X and Y
There are three general reasons we cannot conclude that X caused Y just because
X and Y are correlated (in cases where X is not experimentally manipulated).
First, we don't know for sure that Y did not cause X. I'll use arrows to
indicate causation.
X
----> Y (X causes Y)
but, it might be that Y causes X as
in the following diagram:
Y
-----> X (Y causes X)
Second, we don't know that they
don't cause each other:

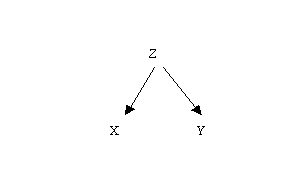
Finally, there is often a third
variable that might cause both X and Y as this diagram points out:

The latter is referred to as the
"third variable problem". My favorite example of the third variable
problem is the correlation between the number of fire hydrants in a city and
the number of dogs in a city. Cities with more fire hydrants tend to have more
dogs. Why the relationship? A third variable. Any guesses what the third variable
might be?