GIS Lesson
Esteban
October 15, 2019
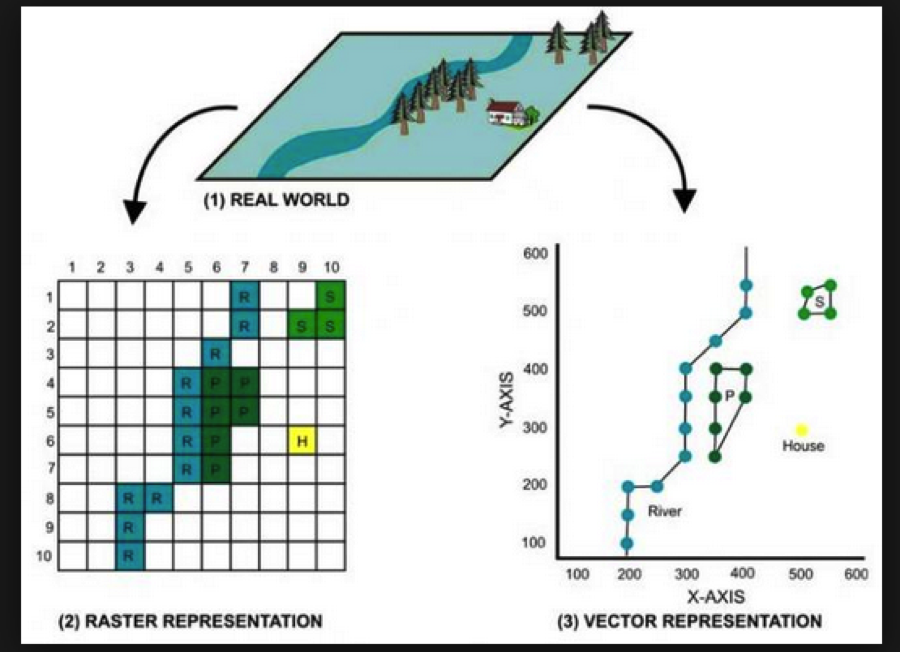
GIS = Geographic Information Systems
Fancy maps using LOTS of data

Goals
- Learn how to use aerial images to analyze the environment
- Acquire data from a free source
- Get introduced to open source geographic software
PS: this lesson is available here
Step 1.
- Open your city’s GIS service (or google maps if you don’t have one)
- For West Linn it is MapOptix

Step 2.
- In MapOptix find where you live
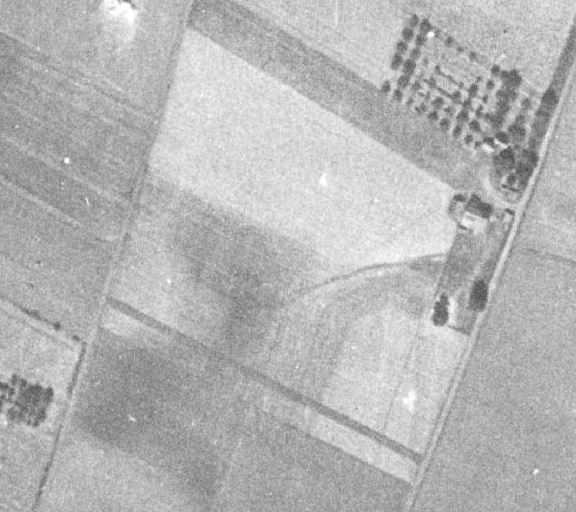
- Turn on the base layer titled “AIR PHOTO 1936”
- Take a screenshot of what the land looked like where your house is now and add it to the google doc. Be sure to:
- scale it appropriately (approximately 1:2400)
- turn off base map overlays
Step 3.
- Turn on the layer “AIR PHOTO 2017”
- Find and record the creek closest to your house
- By turning on the “Environment” layer it is easier to locate streams

Step 4.
- Under the environments tab there is a wetland tab
- Along the top bar there is an option called Query/Info/Measure
- Measure the area (in square meters) of the wetland closest to your house
- Record area and add a screen capture of the polygon you made

Step 5.
- Turn on Flood Management Areas
- Under the Geology tab turn on Landslide Hazards
- Turn on Metro Habitat
- Record whether or not your house falls into any of these polygons. If it does record which ones.
