raman-mapper
A Python GUI for analyzing and characterizing Raman spectroscopy maps (GitHub repo). Support is currently mostly for graphene or other graphitic materials, further materials may be added depending on interests.
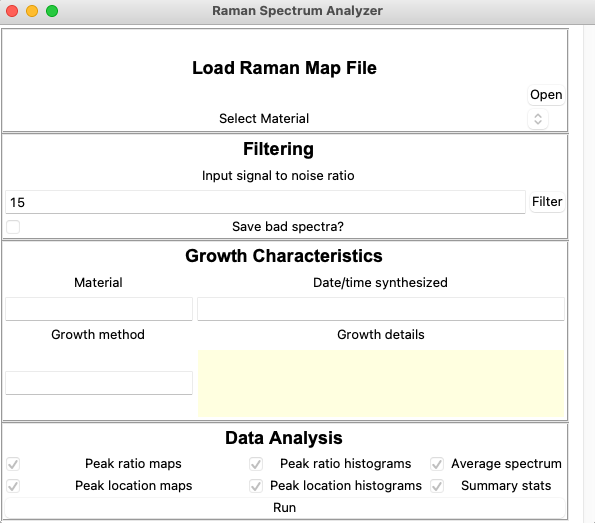
Selected Features:- Simple and intuitive UI
- Ability to filter spectra by signal-to-noise ratio thresholds
- Recording of material properties and synthesis characteristics
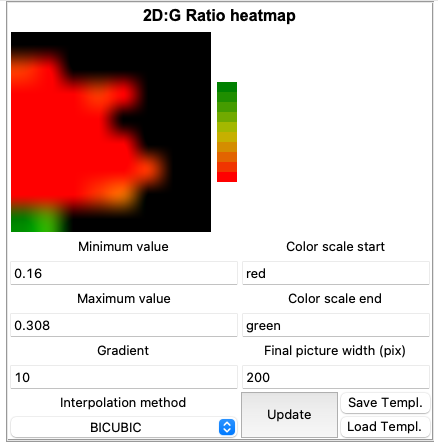
- Creating/modifying heatmaps of spectra statistics
- Creating histograms and summary statistics of map information
GUI Parameter Input
Heatmap Editor
Raman Spectroscopy Basics
Raman spectroscopy is a non-destructive analytical technique used to determine properties of materials. At its core, Raman spectroscopy is concerned with the way that light interacts inelastically with bonds in a material. The basic steps include:
- Shining a laser onto the surface of the material
- The laser light is shifted up or down in energy by bonds in the material
- The shifted laser light is collected and dispersed into separate "buckets" collected via a CCD array
- Intensities for each bucket are recorded and displayed as Intensity vs. Wavenumber (or Raman shift)
In addition to single Raman spectra, it is frequently useful to obtain Raman "maps" wherein many spectra are captured while moving the sample stage by fractions of a micron. These maps give a better idea of how consistent the properties of nano-scale materials are over small distances.
Graphene Raman Spectroscopy
Most of my research focuses on graphene, a single atomic layer of carbon atoms arranged in a 2D hexagonal pattern, first isolated by K.S. Novoselov and A.K. Geim in 2004. In my lab, we synthesize graphene using Chemical Vapor Deposition (CVD) and so need a quick, non-destructive method to determine how well (or how poorly) a growth recipe performed.
The Raman spectrum of graphene consists of three major peaks (D, G, and 2D). The ratio of the intensity of these peaks can tell you a lot about the quality of your graphene. The ratio of the D peak intensity to the G peak intensity provides information about how defective your graphene is (the larger the number, the more defective). The ratio of the 2D peak to the G peak tells you roughly how many layers you have (the larger the number, the fewer the layers). The full width at half-maximum of the 2D peak can also give you information about layer number (the thinner the FWHM, the lower the layer count). The exact location of each peak is useful information as well, as it tell you about lattice stress/strain present in your sample.
The Raman system in my lab is a HORIBA Jobin Yvon HR800, with the 100 mW 532 nm laser typically used for graphene samples.