see multiple-perspectives/patterns/likelihood-method.html
This describes a method to establish the likelihood of a pattern. The example is a fractal-type stream drainage. A simulation (fractal-drainage.xls) is used to generate multiple patterns (models) which are tested against the observed pattern (data).
<!-- I am attempting to put this process in the language of the Ecological Detective (Hilborn and Mangel 1997) to serve as consistent starting point for analyzing patterns, thinking about models and hypotheses and pushing into uncertainty for my Mulitple Perspectives text. -->
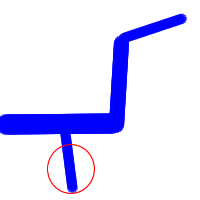
This might be a stream drainage basin.
Translate that pattern onto a grid.
0 0 1 1 0 0 1 0 1 1 1 0 0 1 0 0
In this case use a erosion model with a fixed seed at A3, then let the stream pattern develop from there. Cells next to A3 can erode to be a stream channel or not. This is a time step model in which each time step is another opportunity for the adjoining cells to erode or not. In just several time steps, the model will be able to generate alternative possible patterns for the stream channel in this area.
The total number of possible patterns can be calculated by the number of possible choices at each step. For this grid above, it should take between 3 and 7 time steps to create the stream.
By running the simulation multiple times, stream patterns that have different degrees of similarity to the target pattern can be generated. Since there are multiple ways to reach this final stream pattern, the probability of any pattern is not the same as just calculating the binary probability of the final grid.
<!-- is this the right language here? -->
What is the likelihood of the data given each model? Look for an exact fit of the pattern or work back from patterns that are several steps away, i.e. functional precursors of this pattern.
a. the model (fractal-drainage.xls)
b. multiple runs and accumulated probabilities
c. likelihood calculations
This example illustrates three major points in the TLC framework.
1. repertoire - The observer needs to have a set of possible pattern generating mechanisms that can be applied to this situation. The choices of those mechanisms, makes a big difference in the process. To analyze this pattern, the observer will also need to have a simulation system.
2. observation is primary evidence - The observer sets the patterns that may fit the observed system and then tests models against that pattern. The observed data is the primary focus and the hypotheses are fluid.
3. use simulations to generate variants - Variations in the pattern can be due to simple random chances in the development of the simulated watershed. However, these patterns can be generated in many sequences which should make some sequences more likely than others. For example a input tributary just on grid unit east and then south (see the circle on the diagram) of the seed, could happen at anytime during the time course since no other extension of that tributary pattern depends on it. If there is a pattern that doesn't have these multiple paths for formation, then that will be less likely than this particular path. A more branched pattern should be more likely than a single stem.
In this approach we are looking for likelihood not "truth" or a "provable" mechanism. This makes an important link to the concept of the "precautionary principle" in which we are looking for likely problems that might crop up and cause trouble or damage, and we are willing to suffer some false positives to get a better chance in including those mechanisms in the mix. The same holds here, we are looking for models that may describe the observed data and we would much rather include a candidate model (because we can deal with it) than we are trying to eliminate models. Each subsequent round of study should help us descriminate between the likelihood of the models.
last edited May 8, 2009