Modeling in STELLA
October 27, 2006
This tutorial is designed to go along with the lab sessions on Nov 1 & 2.
This window is intentionally narrow so that you can have these directions open right beside your STELLA program window on the computer. This tutorial will show you what the outcome should be (and you can just try to make a model that looks like that), or if you need help there will be step-by-step directions. You should try to learn to make the model from the diagram and equations. In the future there will not be step-by-step support.
This lab and the next one will explore three ways of using models.
- as simulations - You can explore the response of a hypothetical or model system to changes in the parameters. These simulations let you learn about systems and practice manipulating them.
- to model results - You can attempt to mimic the general pattern and some details of data that you collect. This imitation will not be perfect and how close to reality is adequate is part of the art and craft of modeling.
- to generate hypotheses - You can create models that help you think about the relationships and create new ideas and hypotheses about how a system works.
On Nov 1&2 you will work on the first two parts.
1. The first model is a simple positive feedback growth model.
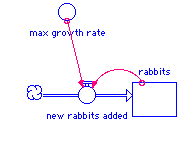
initial rabbits = 100
maximum growth rate = 0.02
new_rabbits_added = max_growth_rate* rabbits
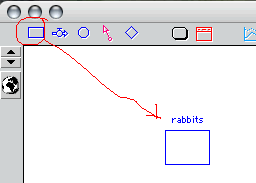
a. click on the reservoir box, position the mouse in the document window and click
name it after the stock
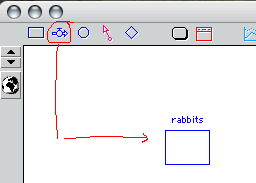
b.do the same for the flow rate icon
move the cursor to the left of the box and then click/drag the arrow and don't release until you are in the box
name it as a rate


d and e. Put in a "converter and add an information arrow from that converter to the flow valve.
name the converter max growth rate
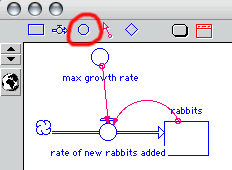
f. start adding values to the icons
click on the global diagram button and it will toggle to be a equation button
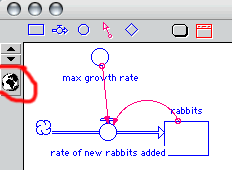
g. double click on each of the stock, max growth rate and rate of new rabbits and add the appropriate values or equation
the equation can be added by using the key pad that comes up or by typing in the line
rabbits = 100
maximum growth rate = 0.02
new_rabbits_added = max_growth_rate* rabbits
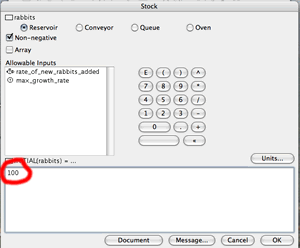
h. create a graph to show the results from the model.
move and resize the graph if necessary
don't forget to pin it down to the document window. If you don't do that it will look like a little shadow icon.
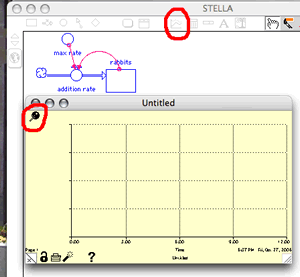
i. double click on the Y-axis and select which parameters you want to see displayed. Pick the name of your stock (i.e. "rabbits").
Hit OK.

j. Use the Run pulldown menu and select run specs. Then change the time for the length of the simulation from 12 to 50 or 100.
Then hit OK
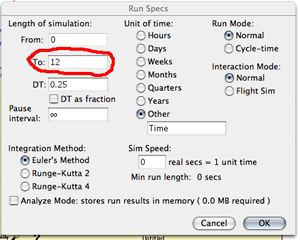

After you run the model and observe the behavior, then you need to be able to describe every feature of this output. You should check if your description works, by predicting what would happen if you changed a particular parameter.
Model 2: We will modify this model to include an depletable resource. In this exercise we will add a new stock called "resources" that are converted to "rabbits" with a one to one ratio. This is an oversimplification that we will use to illustrate the depletion of a finite resource.
2a. Take the previous model and add a new resource box. As you position the stock box right over the source cloud, the source cloud will highlight. When you release the mouse, there will be a flow from the first stock to the second stock.
Since this is a one way, non-negative flow. The increase in rabbits will stop when this stock gets to zero.
It should look like this -->
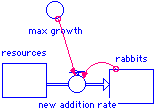
2b. Click on the global/equation toggle, then double click on the resource stock and put a value in for resources such as 200.
Change the run time to 100 or more.
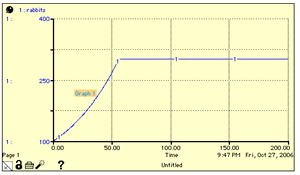
If you have a problem constructing this model, you can easily start from scratch ( a blank document window) to recreate all the stocks, flows and connections.
You should be able to describe what you would change in the model to make the first part of the curve steeper or shallower, or to make the plateau higher or lower.
Part 3: Adding a more realistic resource depletion equation. As resources are depleted and the concentration gets lower, it is more difficult for the rabbits to aquire those resources.
We will go over the reason for the specific equation later but it has the form:
resources/(resources + K)
where K is called the "half-saturation constant".
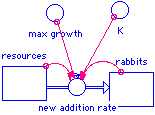
3a. We will add another converter labelled K,
3b. add a link from the resources to the flow,
3c. and we will modify the equation in the flow.
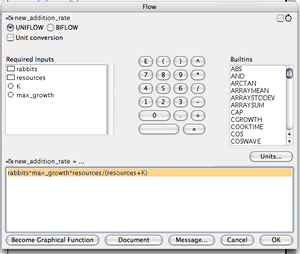
rabbits*max_growth*resources/(resources+K)
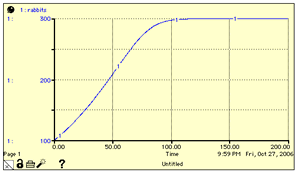
3d. When you run this model it should look something like this -->
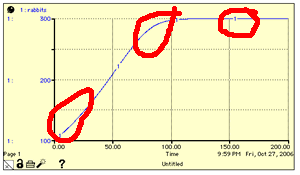
which has a much more rounded transition from exponential growth phase to the plateau
Part 4: Modeling the data that you collect. The purpose of this part of the lab is to measure the flow of water out of a cup with time and then model this in STELLA. The output of the model should look like a volume vs. time.
This will be described in the lab.
The model you will use in this part will look like this -->
You will try to empirically determin a height to flow rate conversion factor.
