The simple model
Photosynthesis is the result of two processes in series, light harvesting and enzymatic fixation of CO2 into sugars. Light harvesting is a linear function of light irradiance for a given amount of pigment and arrangement of the thylakoid membrane. The second step, depends on ATP and NADPH made in the light-dependent steps and the maximum rate is limited by the amount of enzymes in the Calvin cycle.
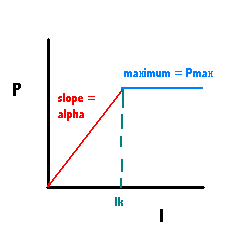
This has been modeled with a "Blackman" model that is two straight lines. Alpha determines the slope of the low light portion and Pmax determines the high light, enzyme limited portion.
Ik is the light intensity at which this system switches from limitation by the light-dependent portion to the enzymatic portion of the photosynthetic apparatus.
This relationship is difficult to write as a single algebraic equation but simple to model in Excel just by using a MIN function.
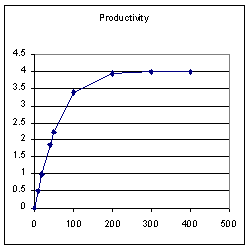
The light response of cells is not so clear cut, and the real data shows a bending of the curve as it nears Ik. The curve is not a typical saturating hyperbola, such as we will see for nutrient limitation. Instead it has been modeled as a hyperbolic tangent function.
The equation is P = Pmax* tanh(alpha*I/Pmax)
The curve to the right shows how this looks with Pmax = 4 and alpha = 0.05.
Including photoinhibition
A problem arises when we try to include photoinibition: It is difficult to create parameters that are as meaningful as they were in the simple model. In particular the parameter that we will use to describe the drop off of P at higher lights is difficult to describe mechanistically. The equation that we will use is also more of a curve fit and less related to the physical processes.
The equation we will use is
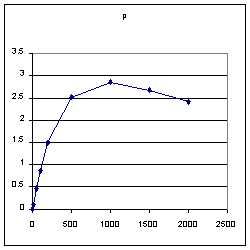
P = Pmax*(1-exp(-alpha*I/Pmax))*exp(-beta*I/Pmax)
If you are unfamiliar with "exp(blah)" it is the same as e to the power of blah.
The paramters for this curve to the right were
- Pmax = 4
- alpha = .01
- beta = .001
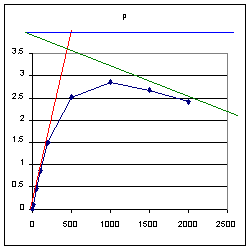
Another way of looking at this curve is by putting in lines that represent the limitations imposed by these different factors.
The red line represents the alpha, the maximum slope of the photosynthetic response to light.
The blue line represents Pmax, the maximum possible carbon fixation.
We have seen both of these before.
The green line runs from the intersection of Pmax on the Y axis and decreases with higher light. This forms an upper constraint due to photoinhibition.
Light vs. Depth
Light is attenuated with depth because of absorption by water, particulates and dissolved organic material. Clearer waters have higher transmission from one meter to the next.
There are other factors that determine the actual light field such as scattering, surface reflection, and differential absorption of the spectrum with depth. We will ignore those in this treatment.
We will use this equation
I = I0 *exp(-Z*Kd)
where:
- I is the irradiance at any depth Z
- Z is the depth in meters
- I0 (eye-zero) is the surface irradiance
- Kd is the attenuation coefficient in m^-1 and ranging from about 0.03 to .4
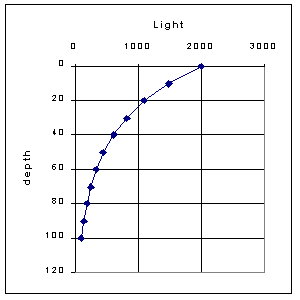
I0 = 2000
Kd = 0.03 m^-1
Productivity vs. depth
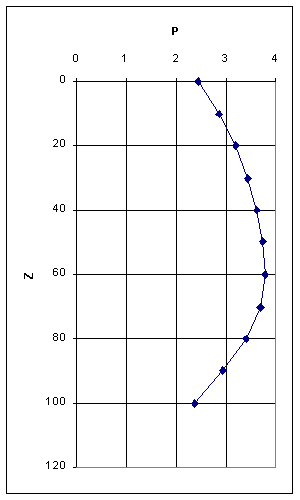
Combing the P vs. I curves and the I vs. Z curves into one representation, allows us to see how productivity will occur with depth (assuming that only light is limiting).
In this example curve:
- Pmax = 4
- I0= 2000
- alpha = 0.01
- beta = 0.001
- Kd = .04
Ranges of parameter values:
alpha from 0.01 to 0.2
Pmax up to 10 mg C (mgChla*hr)^-1
beta from about 0.0001 to 0.002
I0 up to 2500 *10^-6 mol photons m^-2s^-1
Kd 0.03 to 0.41 m^-1
References:
Platt, T., C.L. Gallegos and W.G. Harrison 1979. Photoinhibition of photosynthesis in natural assemblages of marine phytoplankton. J. Mar. Res. 38: 687-701.