PvsE_all_lines.htm
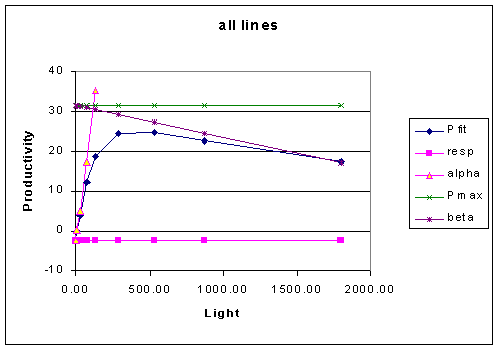
There are four parameters:
resp - the rate of oxygen uptake (given as a negative number) during dark phases of the P vs. E protocol. Not the steady state oxygen uptake rate.
Pmax - the maximum rate of photosynthesis
alpha - the initial slope of the P vs. E curve, for the first 3 or 4 points in our protocol. This line starts at the value of respiration rather than at zero.
beta - the slope of the photoinhibition/photorespiration decrease of photosynthesis at high light. This line intercepts the Y axis at the value of Pmax.
These four lines define the boundaries of the curve. The fit is in the form of the hyperbolic tangent function "tanh" because that seemed to fit the Poisson model the best.
It would be nice to have a more mechanistic explanation of beta. Maybe there needs to be several decrease functions. It is also a problem that the line is linked to the Pmax.
The alpha line is P = alpha*light + resp.
The beta line is P =Pmax - beta*light
Pmax line is Pmax at all values of light and Respiration line is resp at all values of light.
The fit line is P =resp+Pmax*(1-EXP(-alpha*Light/Pmax))*(EXP(-beta*Light/Pmax))
The following figure has these curve fit parameters
- alpha 0.28
- Pmax 31.5
- beta 0.008
- resp -2.47

August 9, 2000