| The purpose of this sheet is to show you one way to model
the heat flux from the warm cup to the colder bath. You should have collected
the data in the lab and calculated a heat flux constant from the slope
of the change in temperature vs. temperature difference at any one time.
This heat flux constant will have the units cal * deg^-1 * cm^-2*min^-1 (calories
per degree difference per square centimeter of surface area per minute).
You will create the model and compare it to your results. You will also
explore the potential loss of heat from the cup to the air by simulating
different heat loss proportions (loss to air compared loss to the bath).
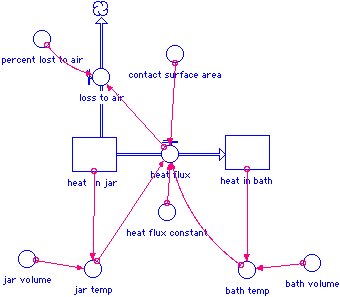
The model diagram:

Model constants and equations:
These are the equations as represented in STELLA.
The initial heat in the bath and cup are calculated by taking the initial
temperature * the volume. This gives a relative heat content above zero
degree celsius (not the actual heat content). For example, if the cup
is 40 C and 100 mL that gives 4000 calories of heat above freezing.
Numbers in red, bold, italics are ones that you'll have to enter into
the model layer.
heat_in_bath(t) = heat_in_bath(t - dt) + (heat_flux) * dt
INIT heat_in_bath = 20000
INFLOWS:
heat_flux = heat_flux_constant*contact_surface_area*(jar_temp-bath_temp)
heat__in_jar(t) = heat__in_jar(t - dt) + (- heat_flux - loss_to_air)
* dt
INIT heat__in_jar = 4000
OUTFLOWS:
heat_flux = heat_flux_constant*contact_surface_area*(jar_temp-bath_temp)
loss_to_air = heat_flux*percent_lost_to_air
bath_temp = heat_in_bath/bath_volume
bath_volume = 1000
contact_surface_area = 50
heat_flux_constant = .5
jar_temp = heat__in_jar/jar_volume
jar_volume = 100
percent_lost_to_air = 0
Set up a graph for the output:
You should at least plot temperature of the bath, temperature of the
cup and heat flow from the cup.
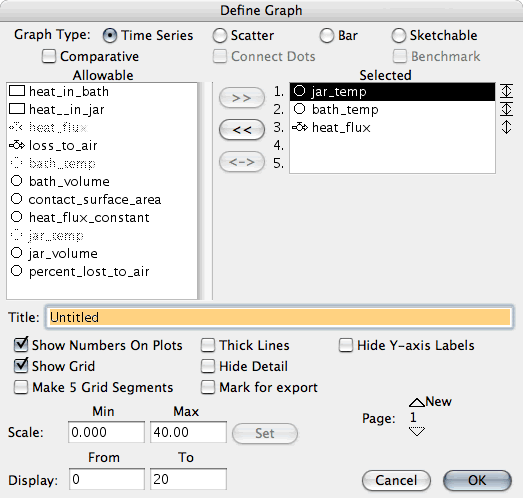
Double click on the Y axis and set the jar-temp and bath-temp to range
from 0 to 40 (or what ever range of temperature you want). The important
point is to fix them both to the same scale.
See the screenshot of the dialog box.
Select jar_temp, then enter the range of temperatures below in the
scale (0 and 40) and then click on the Set button.
Do the same for bath_temp.

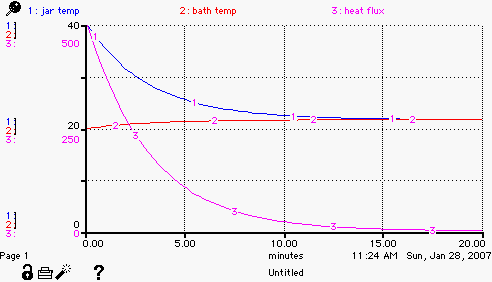
When you are finished and run the model you should get some output
that looks like this. The jar_temp and bath_temp converge to the same
temperature.

Exploring the importance of heat loss to air
You can simulate the importance of heat loss to the air from the cup
by increasing the proportion of heat lost to air. This feature may help
you explain excess loss of heat from the cup that didn't show up in the
bath.
If you suspect that there are other losses or gains of heat in your experiment,
how would you model these?
last modified Feb 15, 2008
|

