

This problem set is worth 10 points. The first half is to create graphs in Excel given the following formulae. The second half is to try to fit equations to the graphs that are supplied (this part will be harder).
Plot each of the following equations over a region that shows the key characteristics of the graph. These characteristics are described in lecture 4 (section 6 and the search table). For example, if the X and Y intercepts are important then your graph must plot this in a region where those are shown.
Each graph could be 1/3 or 1/4 of a page. I don't need to see tables (i.e. Excel rows and columns) just the graph.
a. linear |
y = 12*x + 24 |
| b. polynomial | y = x^2 + 5x + 30 |
| c. exponential | y = 35 * e ^(0.1*x) |
| d. log | y = log(100*x) |
| e. log | y = log (e^(x * .3)) |
| f. trig | y = sin (x) |
| g. trig | y = 50 * sin(2*Pi*x/24) |
| h. sat hyp | y = 200 * x / (x + 25) |
| i. sigmoid | y = 200 * x^2 / (x^2 + 25^2) |
| j. sigmoid | y = 200 * x^4 / (x^4 + 25^4) |
Hints:
x^5 means x to the power of 5
Pi in Excel is a function pi()
e^x would be exp(x)
Describe each graph with an equation and determine appropriate parameters for that equation. For example if you say that it could be described as a linear equation, you'll need to supply the equation Y = m*X + B, plus reasonable values for m and B.
The first three problems are generated from Excel and have all the information you need.
The second set have been taken from a text book and might need a little estimation.
The last set are curves that could be fit by several different equations, and you have to fit each and tell how you'd choose one over the other.
| 1. Write an equation. | 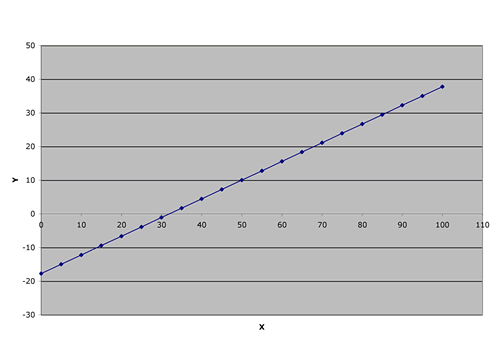 |
| 2. Write an equation. | 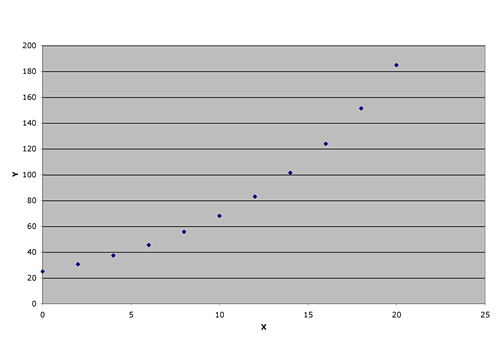 |
| 3. Write an equation | 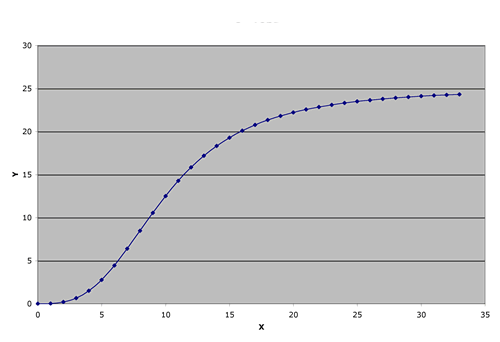 |
| 4.Write an equation for the temperature as a function of the time of year. Jan 1 = 1. | 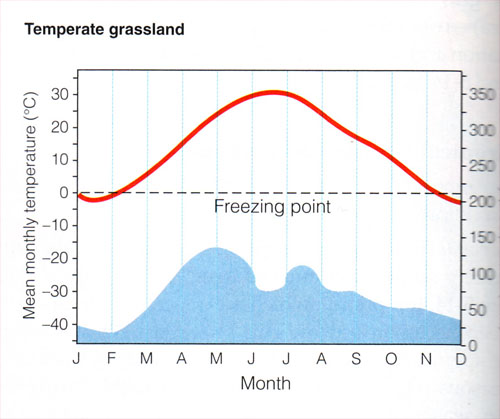 |
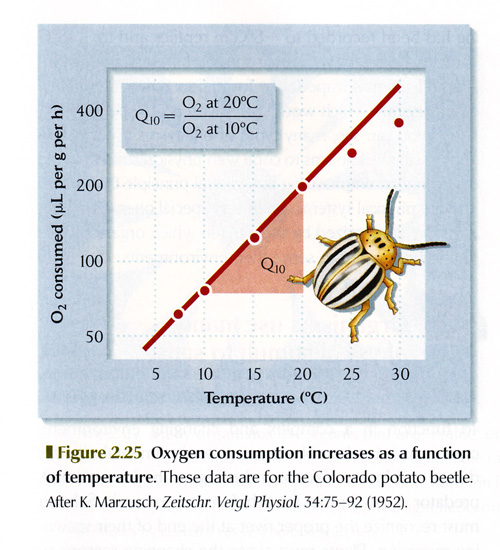
| 5 & 6. Write equations oxygen consumption vs. temperature (the lines in these two figures) AND explain why they are different functions and even going different directions. | 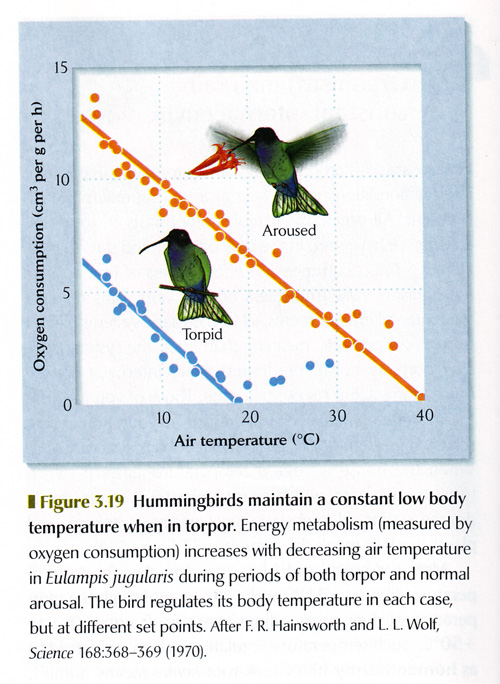 |
 |
|
| 7&8. Provide two different equations for these two graphs | 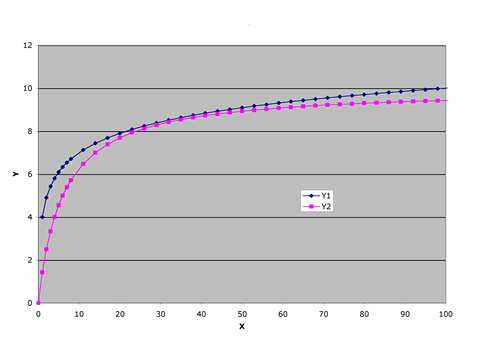 |
| 9 & 10. One of these is an exponential curve and the other is a polynomial. | 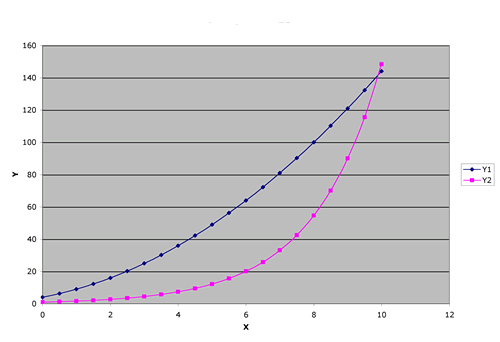 |