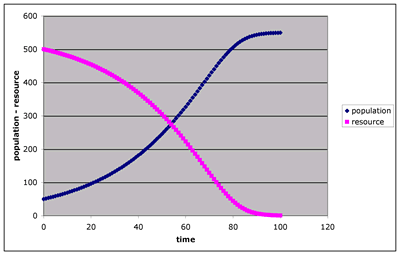
1. (2 points) Create (i.e. make up) three representations/descriptions for growth limitation by resource depletion. You can select any organism and resources. This is very similar to what we did in class and in lab. Make yours different than those. Each of these representations should include nearly all the information.
a. Provide a written description that has all the details needed to formulate the other two.
b. Create a graph (using Excel or by hand) that accurately follows population and resource concentration vs. time. Provide a short figure legend that explains the axes, units and key points of the graph.
c. Write out the algebraic equations that were used in the Excel. Explain each one verbally. Such as, "growth_rate_max is the maximum growth rate of the plants in the units of new plant material per plant per time unit."
2. (2 points) Working from one representation to fill in another.
a. Given the following graph, what are the parameters in these equations.
plant_P + soluble_P = ?

b. If you know that the Vmax is 0.04 and you are given these numerical points on the graph, if the population is 120, the resource is 403 and the uptake velocity (pop*Vmax* R/(Km+R)) is 3.9. Is the Km closest to 10, 50, 100 or 200?
3. (4 points) Pick a graph or chart that represents a quantitative relationship from Miller (or other introductory environmental science text).
a. Provide a copy of the figure.
b. Describe, in detail, what each axis represents and the units of the values on each axis
c. Describe, in words, the relationship portrayed.
d. Provide a mathematical function that would relate these two with approximate parameters.
4. (4 points) Pick a graph or chart from a scientific paper and answer a-d from question 3.
|

