Lecture 10: Examples of using ZNGIs to describe competition and coexistence
Remember a Zero Net Growth Isocline is a visual description of all the points in which the species can grow (at one paritcular loss or dilution rate). All the points above and to the right of the isocline are excess growth and the line is the isocline. Below and to the left are regions in which the algae won't survive.
|
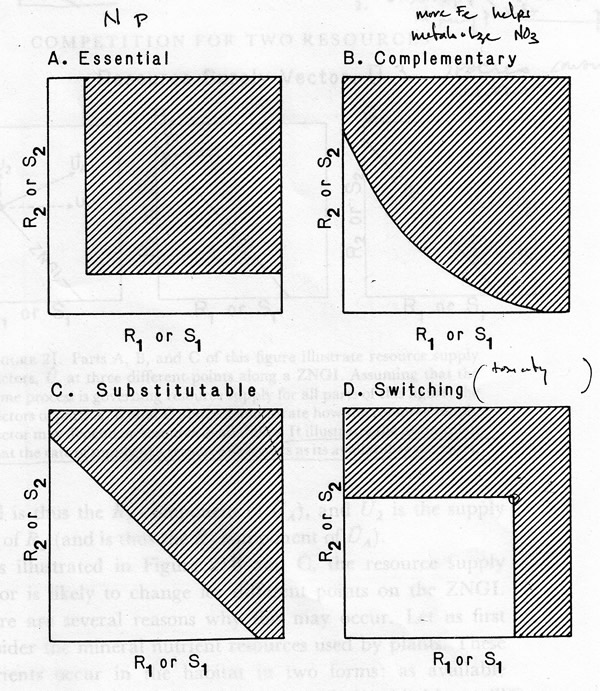 |
There are different relationships between nutrients that can be expressed for a single species.
- upper left - the one we will focus on - both nutrients are required. The cells can be limited by resource 1 or resource 2, or both simultaneously. Anywhere along the left line of the isocline, the cells are limited by resoure 1. Any low concentration of resource 1 would result in a growth rate below that required to maintain ZNG. Similarly, along the bottom line the cells are limited by Resource 2. N and P are good examples of this sort of required relationship.
- upper right - the nutrients can complement each other. When both nutrients are available (middle of the curve) the algae can exist on less than on just one or the other. Examples of this type of relationship are Fe and NO3 - more Fe helps the cells growth on NO3.
- bottom left - totally substitutable. For example cells can grow on NO3 or NH3.
- botom right - toxic - cells don't grow if the concentration of the resource is greater than a certain amount
|
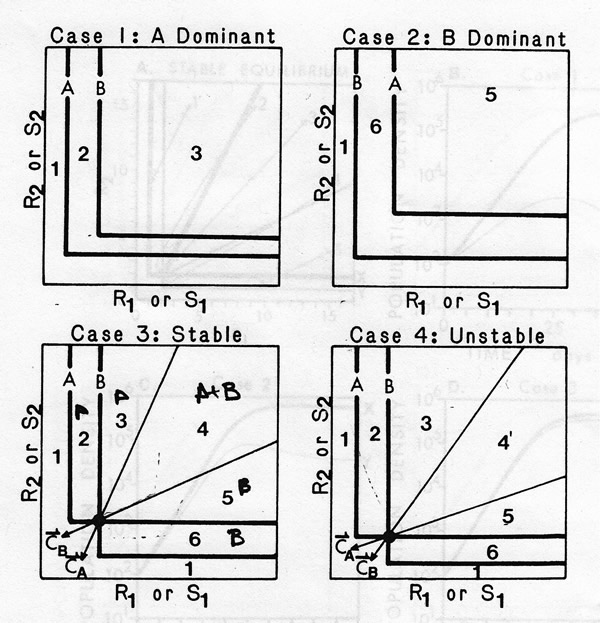 |
This panel shows 4 different outcomes based on the relative ZNGIs for two species for two required nutrients.
- top left - if the ZNGI for species A is always lower than that for species B, species A will always dominate. A can always grow at a concentration of nutrient that forces B to below the replacement level.
- top right - same execpt for B rather that A
- bottom left - it is important to consider the consumption vectors, ie. what is the ratio of R1/R2 taken up by A and B. In this Case A takes up more resource 2 relative to resource 1. In zone 3 A takes up R1 slower than species B and will drive a combination of A and B to cross B's threshold, moving into zone 2.
- bottom right - the consumption vectors are reverstd making the system unstable. It will always go to one or the other species. Don't worry if you don't understand this difference, we won't be using it any more in the class.
|
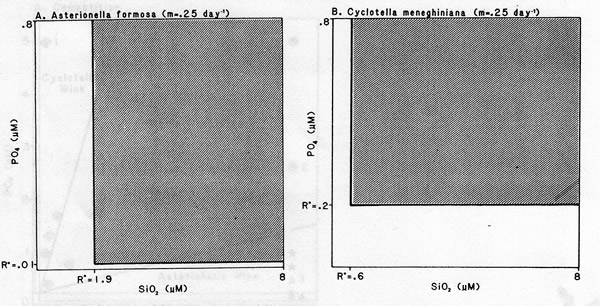 |
This is the data for Astronella vs Cyclotella grown separartly at .25 day ^-1 on ranges of PO4 or SiO2.
You can see that AST is very good at growing to low P and CYC is good at growing to low SiO2
|
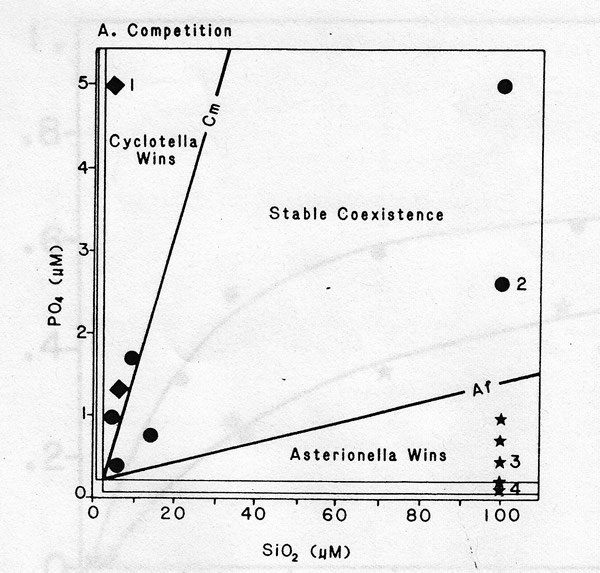 |
Here is the ZNGI diagram for those two figures combined. Compare this combined figure to the ones above.
This diagram predicts which species should win given a variety of starting nutrient concentration ratios (PO4/SiO2). The figure below shows the competition. Notice that these go out over about 30 days. |
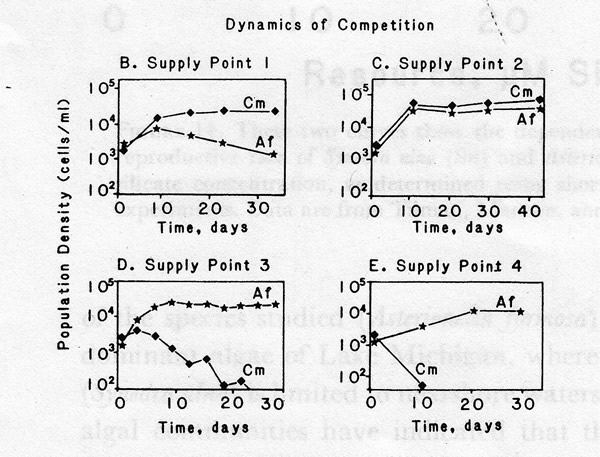 |
| Look at the supply points in the ZNGI diagram and explain each outcome. |


