Introductory comments
Themes for this week
Network approach provides us with visualizations that are useful for studying and presenting key features of complex interactions.
A key metric of a network is it's level of connectivity, i.e the average number of connections per node.
Intermediate connectedness leads to a range of behaviors that we associate with healthy ecosystems such as; compensatory responses, resilience, and critical threshholds.
Resilience is the ability of a network to handle stressful perturbations and still continue functioning in essentially the same way.
This lecture:
- Two types of network representations: 1) node and arrow, and 2) grid
- Node and Arrow
- Metrics and behavior of networks
- Grid
- Impact of habitat fragmentation
- communicating with network visualizations
- summary
1. Two types of network representations
both present a representation of a complex system that has some obvious homology to the problem
talking about the problem
"Node and arrow" or
"node and link" |
 |
| Grid |
 |
2. Node and Arrow representations
a. can look very similar to stock and flow
last week we had this systems model of multiple trophic levels
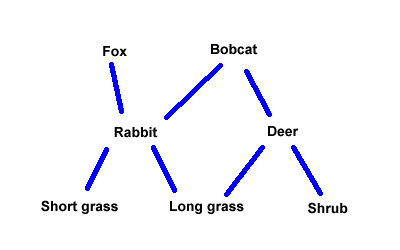
a drawing of an ecosystem - organisms are the nodes
links could represent
- positive or negative
- energy flow
- other relationships such as dispersal of seeds or insect protection
- art of the model - get the right level of detail for the intended use
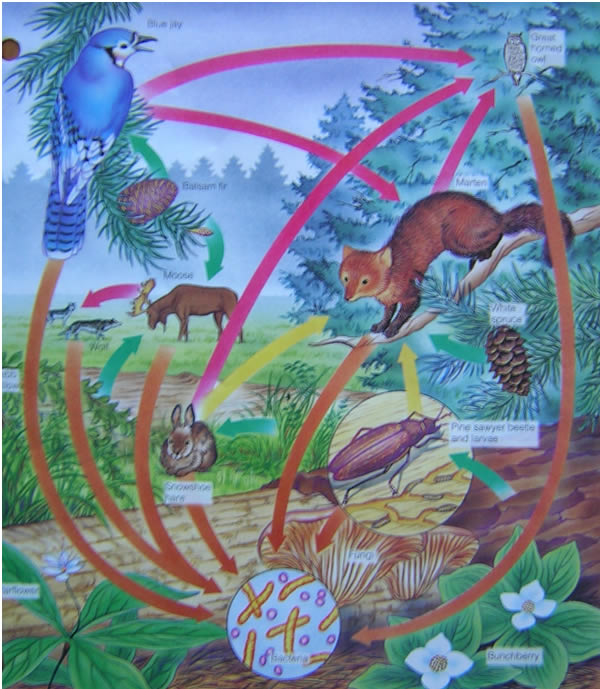
node and arrow representation
3. Metrics, description and behavior of networks
- size - number of nodes (7 nodes)
- diameter - maximum distance (number of links) between any two nodes (max distance is 2)
- average links per node = 8 links/7 nodes = 1.14
- connectance = links/total possible (8 links / (7*6/2)) = 8/23 = 0.35
- more casually - that we will use
- low connectivity across the network - may be parts that are poorly connected or isolated
- intermediate - range of connections between nodes from outcasts to the social butterflies
- over connected - almost all nodes directly connected to each other
behavior
low connectedness, parts act as individual networks
intermediate connectedness, stresses shared across the network, range of responses because of the diversity of the network connections themselves
over connected - if one node is impacted, all are
several examples of intermediate connectivity:
compensatory response
which is related to threshhold and resilience
resilience is the ability of the network to keep functioning under perturbations (and not fall apart)
compare to the metaphor of rivets on a airliner
4. Grid networks
landscape connectivity
habitat fragmentation
There is a critical level at which the maximum habitat size starts to get rapidly smaller for each change in disruption.
threshhold and resilience
intermediate connectivity "maintains" paths and habitat size until the landscape gets very fragmented
fragmentation is undesirable for biodiversity because
it causes isolated sub-populations that may not be able to breed effectively (in breeding)
or when a small event happens it wipes them out, locally (bad luck)
5. Relationship between landscape networks and biodiversity
using biodiversity as a proxy for healthy ecosystems
intermediate connectivity
- habitat connections even with development
- some protection from widescale changes, because of the variations
- saw this with fire across the landscape
mosaic of patch types
- like in the forest fire picture
- many different ages of vegetation
- supports different types of plants
- supports wider range of animals and processes
- the starting plants and animals for any new patch are already just next door (or close anyway)
- disturbances are shared throughout the network without crashing any one part (resilience)
within patch - succession, succession stages, succession pulses
- some plants are pioneers
- prepare the habitat for other species that can grow faster
- example (moss and lichen, low shrubs, trees that fix nitrogen, larger conifers)
intermediate disturbances
- lightening strikes
- results in a mosaic
mosaic pattern is resilient because
intermediate connectivity and intermediate disturbances lead to mosaic patterns
paraphrasing - why is circular logic eschewed when the logic of nature is circular
Bateson, Gregory. 2002. Mind and nature: A necessary unity. Hampton Press,
Inc. Cresskill, New Jersey.
You will study this in the simulation, think about this self-reinforcing relationship and how that is really what underlies resilience.
6. Communicating and discussing complex problems with network diagrams and analysis
democracy requires discussion in the public sphere
if just experts decide, that's a technocracy
tools need to be at the right level - see the video by Eric Berlow
Example: talking about a complex problem in a lake
Research group - builds a network description
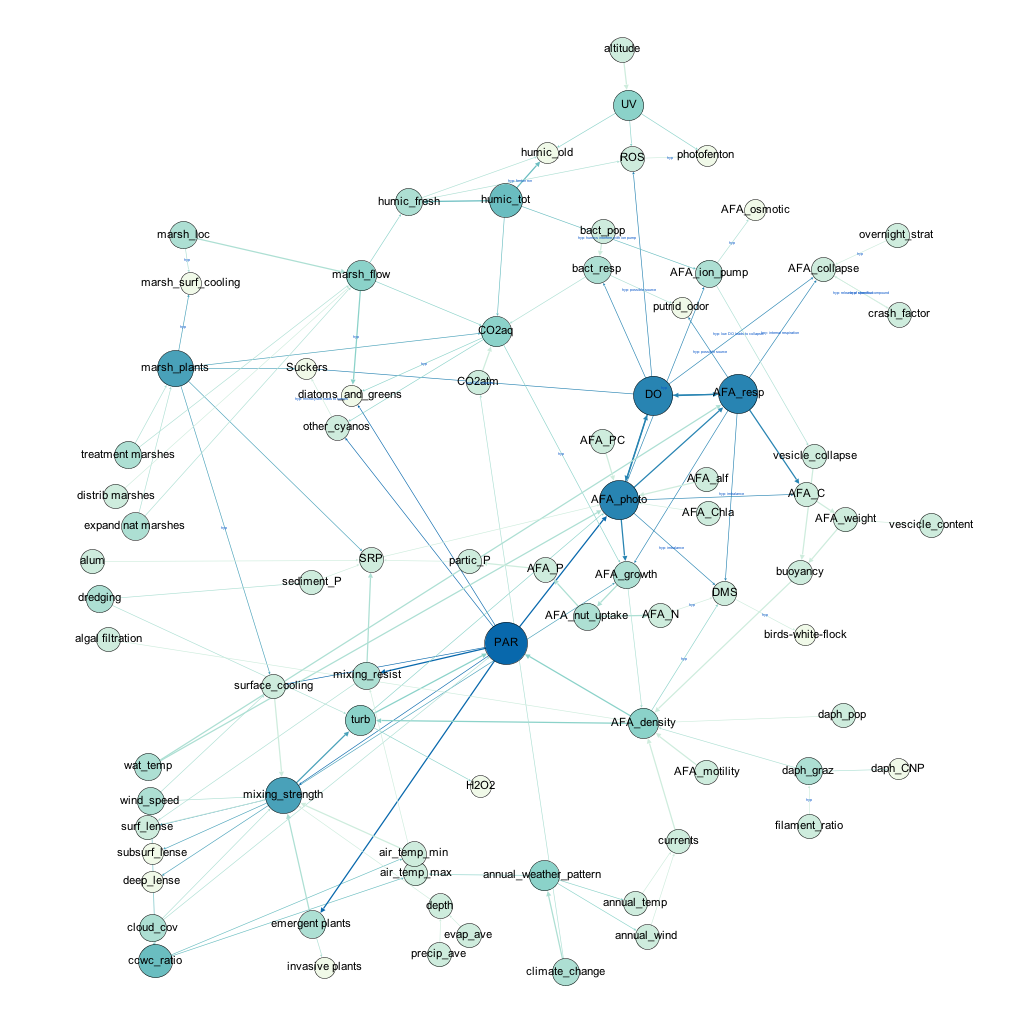
discuss particular links - maybe in an open forum and capture comments
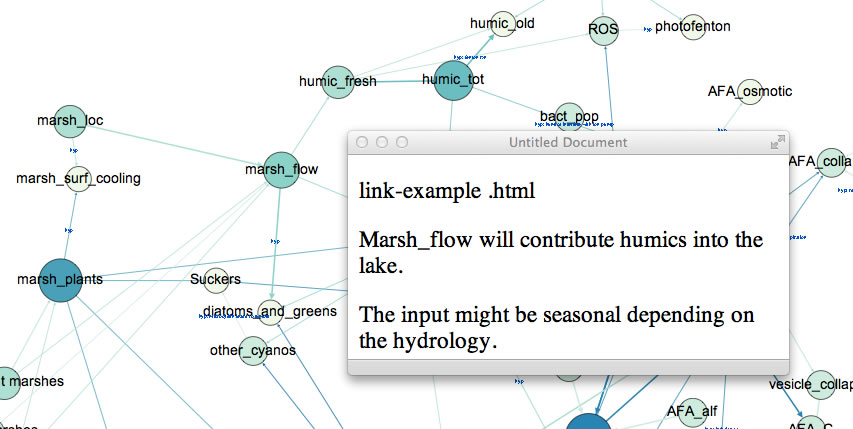
discuss particular components - such as MSS

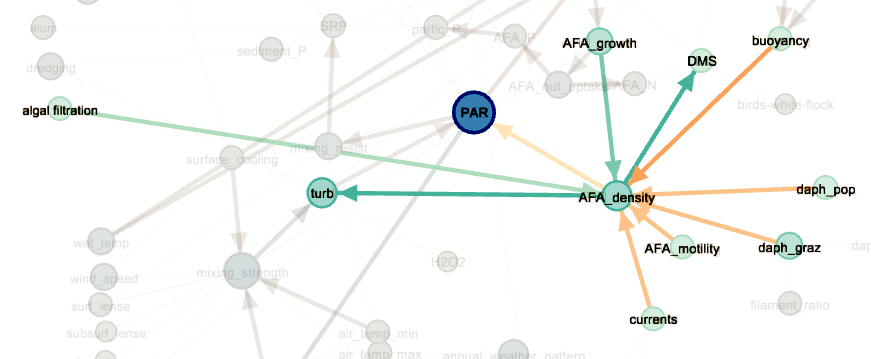
examine linkages to see if any others are needed
7. Summary
Network description can be used along with patterns and stock and flow.
Address problems that have complex interactions, and maybe make those interactions understandable or put in the context of overall network behavior.
Network diagrams are also good for discussing what we don't know -- which nodes and links don't we understand.
|