A. Steps for Fitting P vs. E data
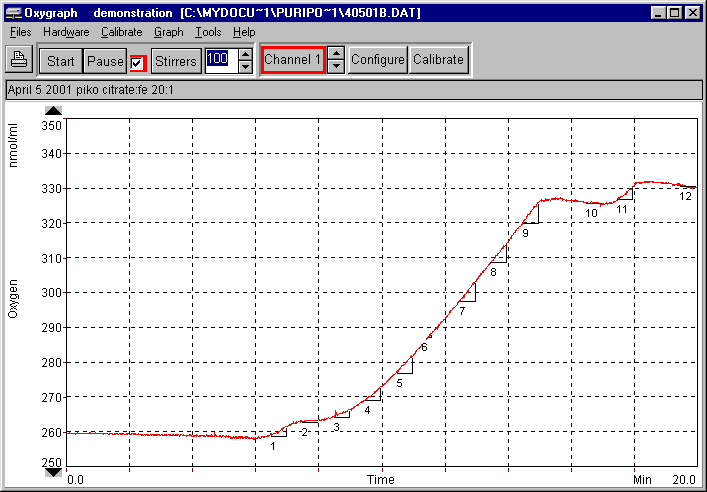
Trace of [O2] vs. time
rates taken from slope of line
Steps 1 and 2:
fit the first several points at low light to be alpha
fit the last several points (above saturation) to be beta
Step 3:
find the Pmax that gives the least sum of residuals
Step 4:
Plot all on one chart
B. Transient response going from light to dark.
This shows that there is some "excess" oxygen produced after the lights are turned off.
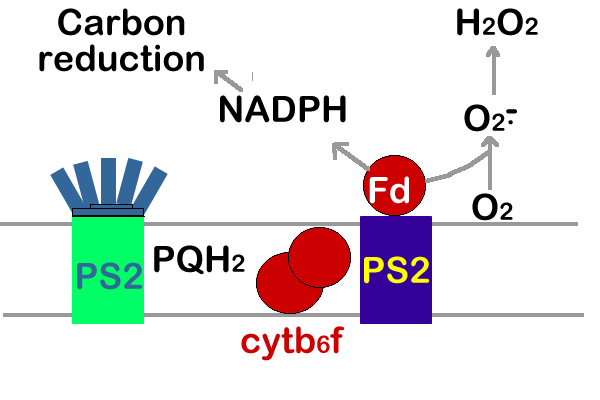
We think this "excess" O2 comes from H2O2 breaking down, and the H2O2 comes from the Mehler reaction.
Production of H2O2 in the light from the Mehler reaction.
Net change of H2O2 to O2 in the dark.
2 H2O2 --> 2 H2O + O2
Direct measurement of H2O2
scopoletin measures production rate, not concentration
concentration would be lower than that at steady state production and destruction
values compare favorably
scopoletin: 1.11 uM/min H2O2 produced at 2275 uE m^-1 s^-1
offset method: 0.41 uM excess O2
The observed response.
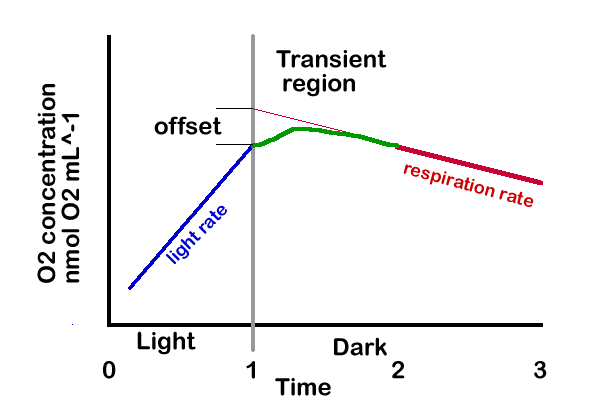
When the light is on, there is an increase in [O2].
At the same time there is production of H2O2 and decomposition to O2 taking place that is in a steady state.
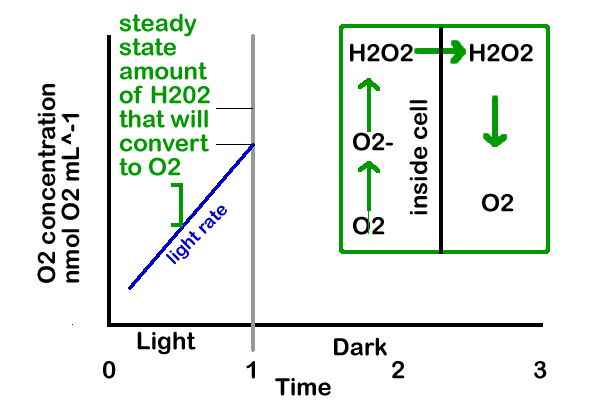
When the light is turned off, the cells have a net uptake rate of O2.
If there were no H2O2 present, the observed line would be linear, starting as soon as the lights were off.
In the dark, no more H2O2 will be produced and there will be a net breakdown on H2O2 and a net addition of O2.
The rate of breakdown will depend on the concentration of H2O2.
With time, over about a minute, the H2O2 will decrease to zero and the O2 added to the media (from H2O2) will reach a constant level.
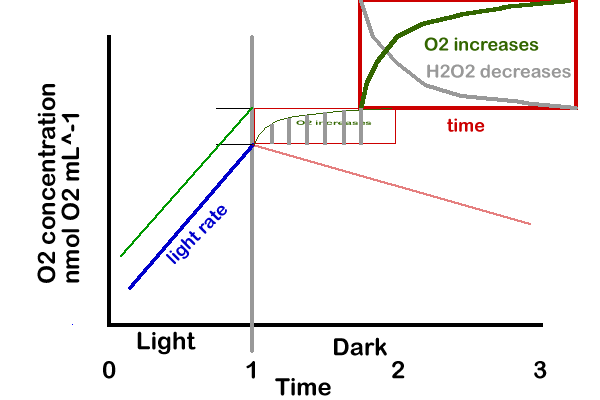
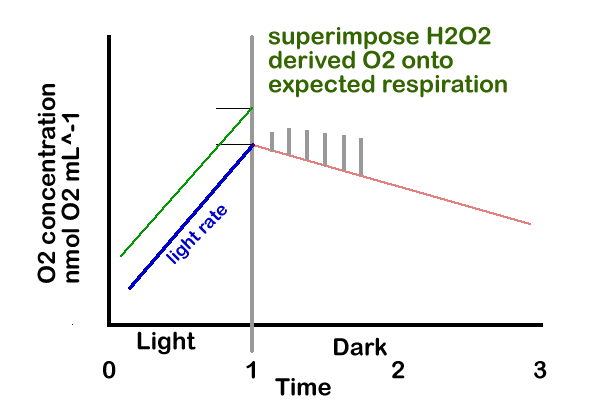
The rate of [O2] decrease becomes linear when all of the H2O2 has been converted to O2.
In order to separate out the contribution of H2O2, we can extrapolate back to the point where the light was turned off. The difference between that extrapolated value and the end of the light period, is the excess [O2] contributed by H2O2.
The observed data with:
light rate
transient region
offset = H2O2 derived O2
respiration rate

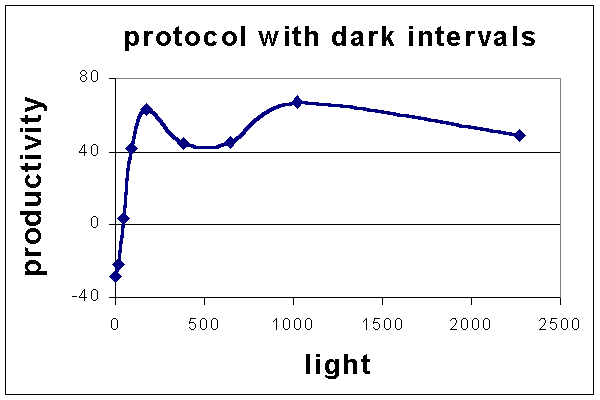
Disparity in the Photosynthesis can be explained by the transient
lower rates than expected at 380 and 530
these follow dark periods in the protocol
change the protocol to eliminate these dark intervals, those points increase up to expected levels
