Figure 1. Decrease in the photosynthetic rate (as % of initial rate) with a decay constant of 15 minutes and a inhibition constant of 3 x 10^-4.
algae/course_notes//dynamic_inhibition.htm
This page is based on the paper by Pahl_Wostl and Imboden
Pahl-Wostl, C. & D. M. Imboden
1990
DYPHORA - a dynamic model for the rate of photosynthesis of algae
Journal of Plankton Reseach
V 12 pp 1207-1221
Instead of trying to estimate the decrease in photosynthesis at high light with beta (see other pages on this site); Pahl-Wostl and Imboden suggest that a dynamic model photosynthesis be used. Their model has a term that represents and accumulation of an inhibitor (although they are careful to explain that this isn't a physiological model). This inhibition function increases with light exposure greater than a critical value and decays away with a characteristic decay rate.
For my purposes I ignored the time constant for the increase in photosynthesis and, instead, focused on the decrease of photosynthesis with time of exposure to high light levels.
Over an exposure to high light, the rate of photosynthesis should decrease (figure 1). The decay rate will eventually reach an equilibrium where the increase in the inhibition function equals the decrease via decay.
Figure 1. Decrease in the photosynthetic rate (as % of initial rate) with a decay constant of 15 minutes and a inhibition constant of 3 x 10^-4.
The steepness of the initial decrease is mostly related to the K and the light exposure. You would have to measure this same decrease at several light levels to determine the K and decay constant. The critical light is the light level that just below the inhibition causing threshold.
Even during a P vs. E curve, lasting only 30 to 40 minutes, the high light levels may result in dynamic inhibtion of the rate.
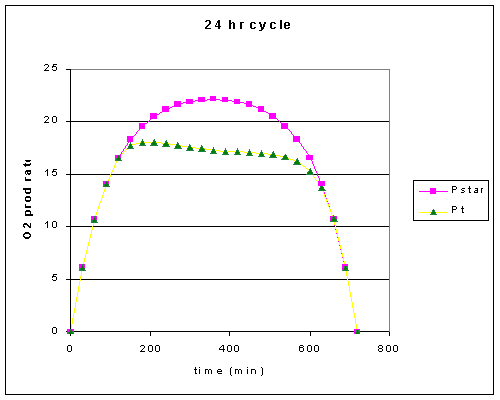
The potential photosynthetic rate and that predicted with the dynamic inhibition are shown in Figure 2. The critical light intensity is set at 800. Increasing K or decreasing the Ecrit will decrease overall photosynthesis most drammatically. The time constant for decay becomes more important when a fluctuating light regime is used ecause the slow decay of the inhibition function could interfere with the ability to use subsequent spikes of light.

Figure 2. Photosynthesis over a 12 hour light period using a simple sin function to give the light level. K = 3 x 10^-4, the decay constant = 15 minutes and the Critical light level = 800 uEm^-2s^-1.
The dynamic inhibition could be modelled using STELLA or EXCEL and compared to data from P vs. E curves and other time course measruements
Additional measurements should be made on one sample at a fixed light intensity for about 60 minutes. This should be repeated at several different light levels. The critical light level should result in minimal decrease in photosynthesis.
The model for dynamic inhibition should consider the build up of [O2] as a possible contributing factor causing the inhibition. The light exposure needs to be normalized to give the light exposure of the cells. This will be important in comparing low and high density cultures for their sensitivity to light.
Pahl-Wostl and Imboden (1990) put this model into the context of Reynold's work. They predict that cells that are adapted to mixing will have a fast rate of increase in photosynthesis relative to mixing time scales, should absorb over broad spectrum, and will have a lower maximal efficiency (in part due to the pigments needed to absorb across a broad spectrum).
Excel file: dyphora2.xls
August 21, 2000