August 29,2005
Measurements conducted on 2005.08.24 and 2005.08.25 at Oregon State
PAM Fluorometer measurements on 8 treatments with 4 replicates each
Control A
Control B
BSE 1%
BSE 5%
BSE + BS 1%
MPB-A 1%
MPE-B 1%
MPE-B 5%
data in files: algae/barley/050824.xls and 050825.xls
Fmax should be roughly proportional to the total amount of AFA and other algae in the bottles
Fv/Fm is a proxy for the photosynthetic efficiency
Table 1: Fmax and Fv/Fm for the 8 conditions
| condition | Fmax | std dev | Fv/Fm | std dev |
| Control A | 1527 | 765 | 0.293 | 0.013 |
| Control B | 1028 | 201 | 0.264 | 0.062 |
BSE 1% |
796 | 493 | 0.300 | 0.058 |
BSE 5% |
959 | 190 | 0.330 | 0.025 |
| BSE+BS 1% | 270 | 124 | 0.350 | 0.038 |
| MPE-A 1% | 1458 | 353 | 0.337 | 0.027 |
| MPE-B 1% | 504 | 100 | 0.272 | 0.073 |
| MPE-B 5% | 479 | 137 | 0.266 | 0.022 |
In summary the data in this table show that the controls had the among the highest total fluorescence but the MPE-A 1% was also very high. The lowest Fmax was the barley straw extract and the straw together but this treatment had the highest Fv/Fm, indicating high photosynthetic efficiency and health. This
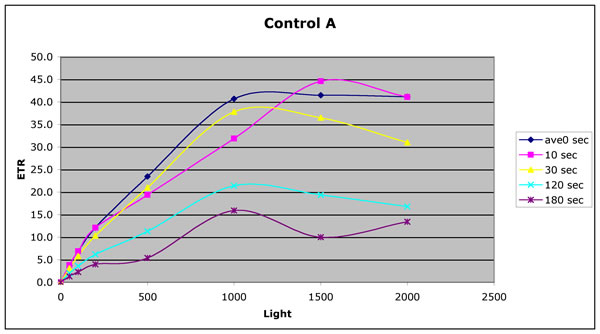
I examined the photosynthetic response (ETR vs. Light ) on four bottles in more detail. They all showed very similar curves and sensitivity to light.
Control A - replicate 1
Barley straw extract at 5%
Barley straw extract and barley straw at 1% w/v
Marsh Plant Extract -B at 5%
The maximum ETR varied between the different samples. The average of the 0 second exposures was usually very near the maximum rate in the range from 1000 to 1500 uEm^-2s^-1. The maximum ETR was actually in the condition that had the lowest total fluorescence. This high response of the BSE+BS 1% supports the high Fv/Fm seen for those samples. Interestingly the control had the lowest maximum ETR which could indicate that it had already peaked in growth. We might have to follow these more closely with time.
condition maximum rate of the 0 sec average Control A 41.5 BSE 5% 65.9 BSE+BS 1% 83.7 MPE-B 5% 46.7
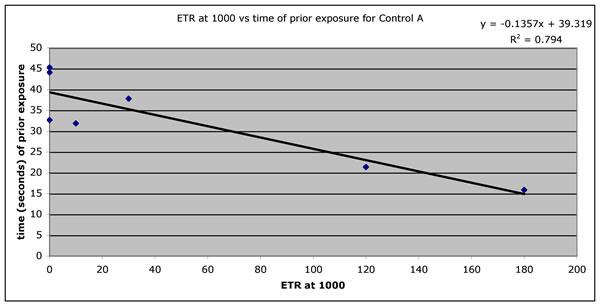
The rate of decrease in ETR varied with these samples:
condition slope of decrease Control A -0.1357 BSE 5% -0.1462 BSE+BS 1% -0.2905 MPE-B 5% -0.1605
The highest rate of decrease was seen in the culture (BSE+BS 1%) that had the highest maximum rate. This may simply indicate that the light inhibited the cultures to nearly the same level, thus the higher initial rate results in more inhibition.
In the past I have used the Non-photosynthetic quenching parameter (NPQ) as an indicator of the cells' ability to dump excess light energy. This technique looked promising last year.On these samples however, between one and three seconds of exposure to full light completely knocked out the NPQ. I think this may be an artifact of how these cultures were grown. It is crucial that I check this on natural samples of AFA as soon as possible.