Pablo Baldivieso
Assignment 6
Problem 1
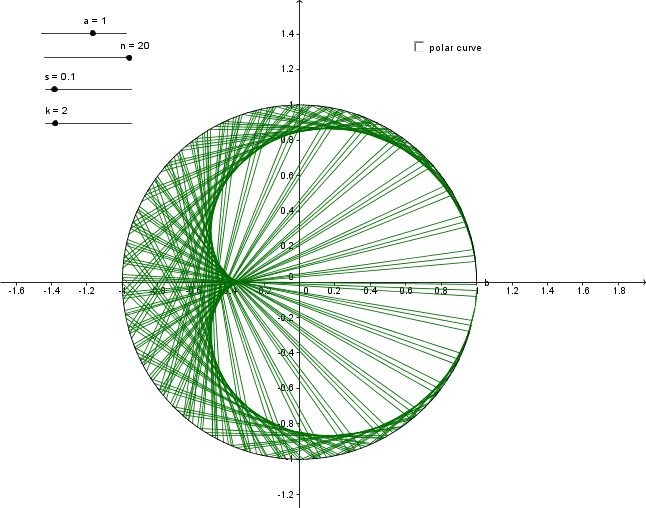
The parametric graph x = a cos(t), y = a sin(t). We set a parameter n
which ranges from 0 to 20 with increments equal to 1 and the parameter
s which
ranges from 0 to 1 with increments 0.1. The curve is created
using command <curve>. The curve can be evaluated at a particular
point,
let's say c(i). Then a sequence of segments connecting points on
the curve, c(i) to c(2*i).
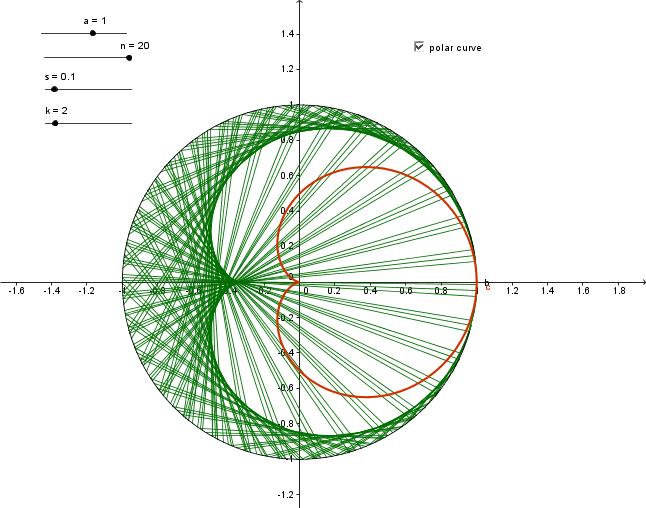
If we include the polar curve r(t) = 1+cos(t) we can see that the
envelopes follow the curve r(t).
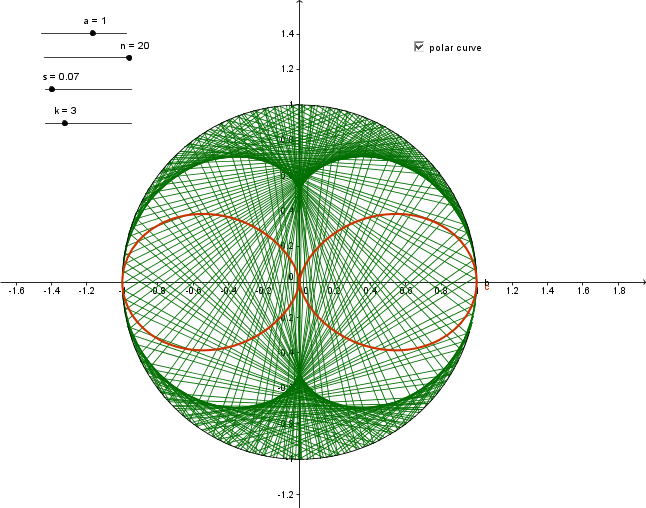
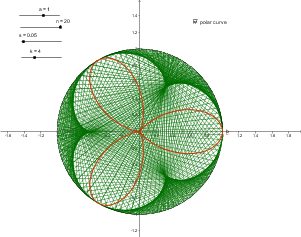
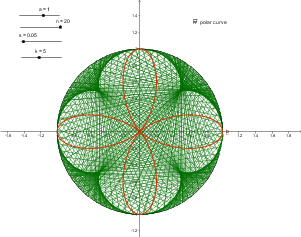
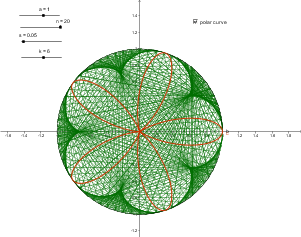
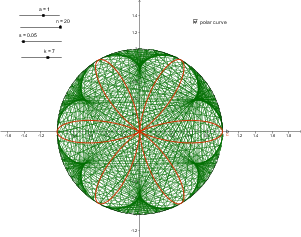
Now we change the envelopes lines to be lines from c(i) to c(k*i) for
k= 1,2,.. 10. and the corresponding r(t)=a/2 + a/2cos((k-1)t). The
envelopes and the graphs have the same shapes.
Problem 2
For the ellipse case, if the free point is located either inside the
circle, or outside the cirlce the shape of the envelopes curves are
different. For example when the freepoint is located outsised circle we
have Figure 1 and figure 4, which are known as Limacon. however when
the free point is inside the circle we have Figure 2 and Figure 3.
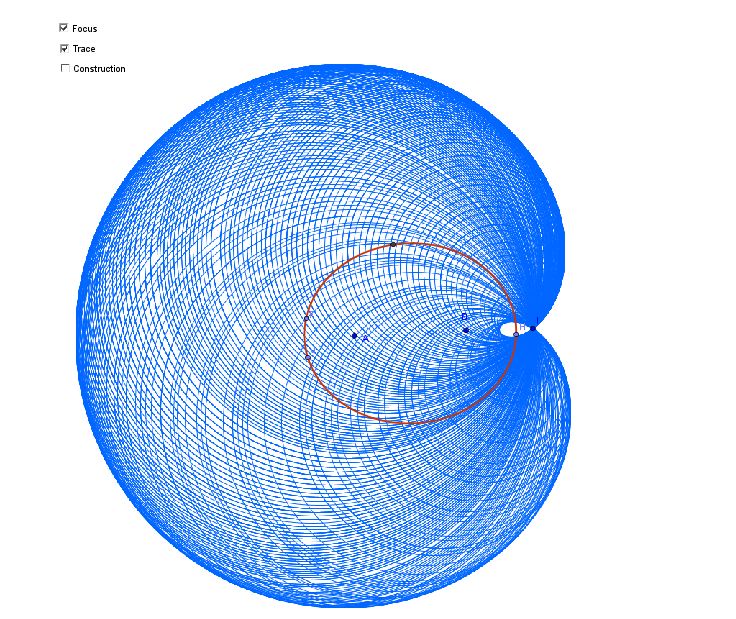
Figure 1
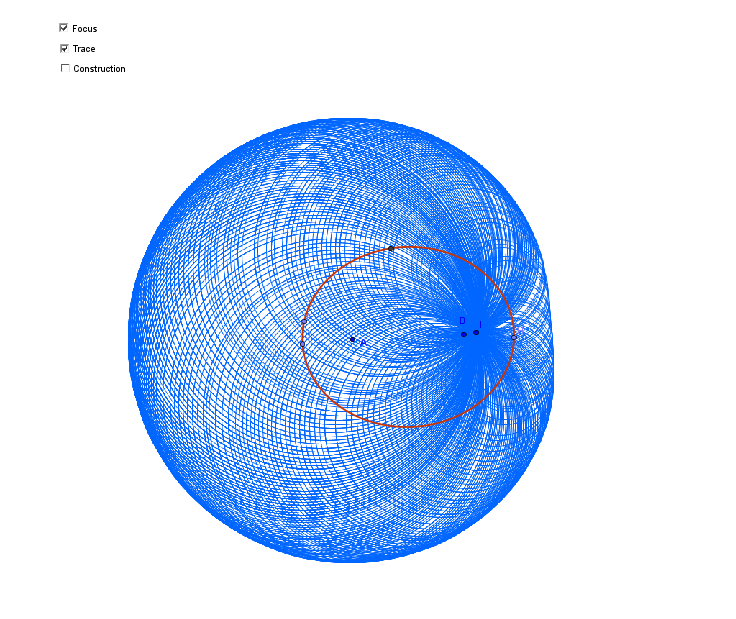
Figure 2
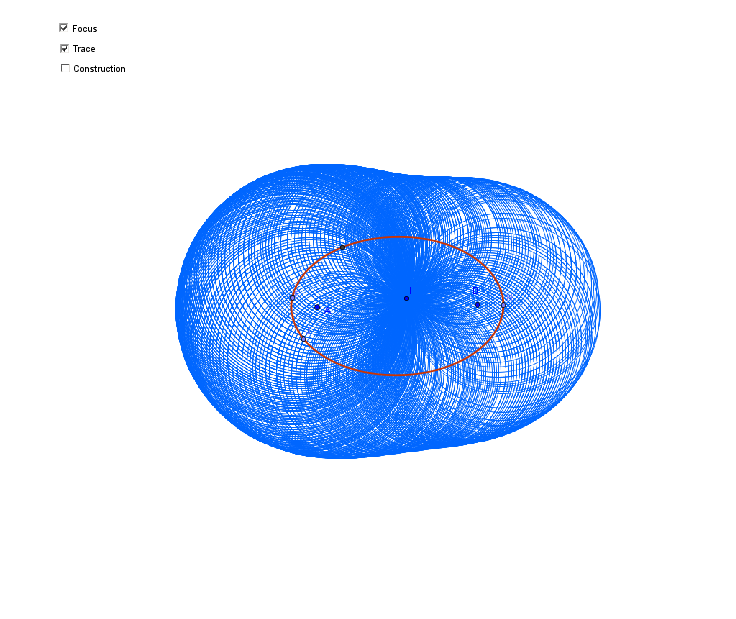
Figure 3
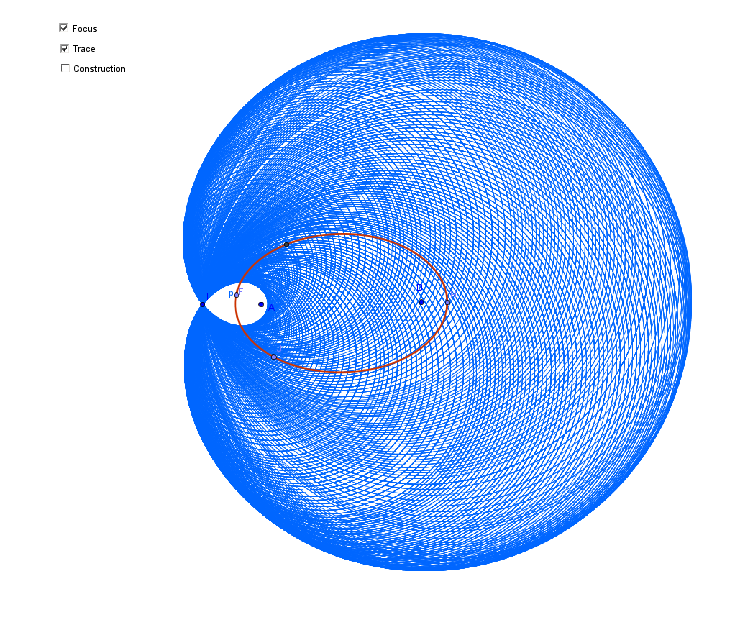
Figure 4
For the hyperbola the special case is when the free point is located at
equidistance from the foci the envelopes leave two holes creating a
symbol similar to the infinity symbol, see Figure 6.
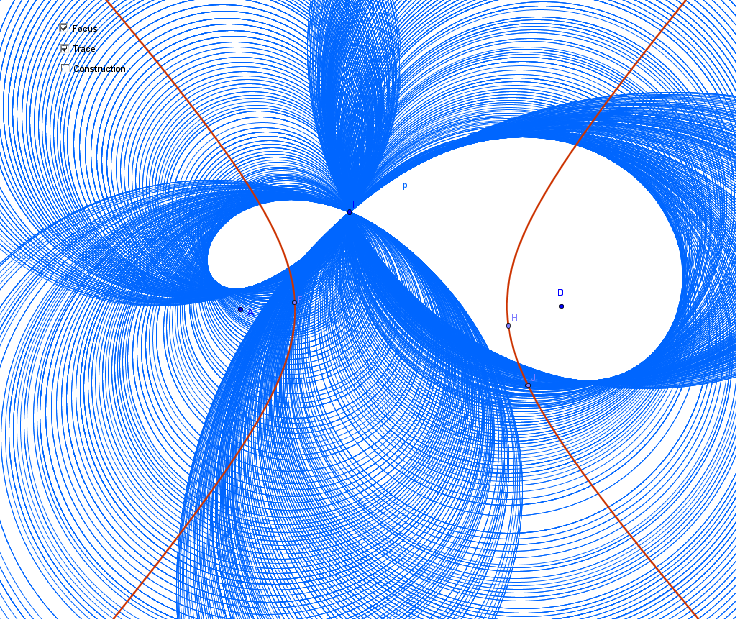
Figure 5
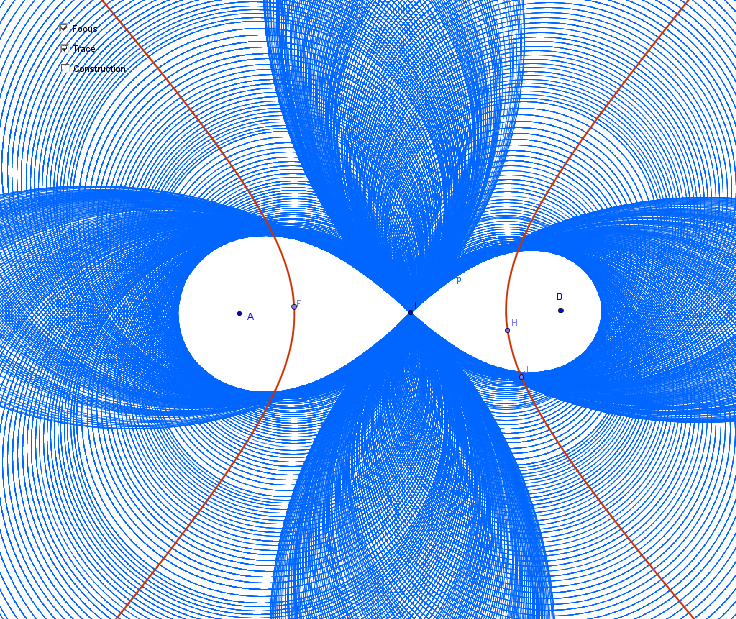
Figure 6