Habitat
Evaluation Procedure (HEP) - U.S. Fish and Wildlife Service
Wetland
Evaluation Technique (WET) - Federal Highway Administration
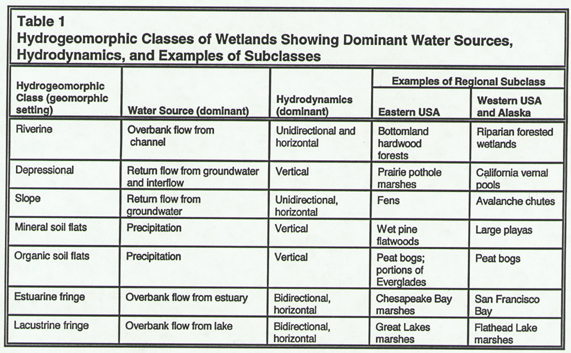
Hydrogeomorphic
Approach (HGM) - U.S. Army Corps of Engineers
Economic
Approach
-willingness to pay
-replacement costs
�
Return to Week 5 - Lecture 2
Return to overhead index
HEP Method Output
| |
|
Furure with Project Plan "A"b |
Furure with Project plan "B"c |
Furure without Project |
Species |
Baseline Condition |
50 yrs 100yrs |
50 yrs 100yrs |
50 yrs 100yrs |
| |
|
Terrestrial |
|
|
Racoon |
0.7 |
0.5..................0.6 |
0.8.................0.8 |
0.7.................0.9 |
Beaver |
0.7 |
0.2..................0.2 |
0.4.................0.3 |
0.6.................0.4 |
Swamp Rabbit |
0.7 |
0.2..................0.2 |
0.8.................0.8 |
0.7.................0.4 |
Green Heron |
0.9 |
0.2..................0.1 |
0.8.................0.9 |
0.9.................1.0 |
Mallard |
0.8 |
0.3..................0.2 |
1.0.................0.9 |
0.9.................1.0 |
Wood Duck |
0.8 |
0.3..................0.2 |
0.9.................1.0 |
1.0.................1.0 |
Prothonotary Warbler |
0.8 |
0.3..................0.1 |
0.6.................0.7 |
0.8.................0.9 |
Snapping Turtle |
0.8 |
0.4..................0.2 |
0.8.................0.7 |
0.8.................0.9 |
Bullfrog |
0.9 |
0.3..................0.3 |
0.8.................0.9 |
1.0.................1.0 |
Total Terrestrial HSI |
7.1 |
2.7..................2.1 |
6.9.................7.0 |
7.4.................7.5 |
Mean Terrestrial HSI |
0.8 |
0.3..................0.2 |
0.8.................0.8 |
0.8.................0.8 |
| |
|
Aquatic |
|
|
Channel Catfish |
0.3 |
0.3..................0.4 |
0.4.................0.4 |
0.4.................0.4 |
Largemouth Bass |
0.4 |
0.2..................0.3 |
0.7.................0.8 |
0.4.................0.4 |
Total Aquatic HSI |
0.7 |
0.5..................0.7 |
1.1.................1.2 |
0.8.................0.8 |
Mean Aquatic HSI |
0.4 |
0.3..................0.4 |
0.6.................0.6 |
0.4.................0.4 |
Fig.15-5. Comparison of the Impact of Two Management Plans and
a No-management Control in a Cypress-Gum Swamp.*
*` Numbers in
the tables are habitat suitability index (HSI) values, which have a maximum
value of 1 for an optimal habitat.
b` Chanelization
of water and clearing of swamp for agriculture development with a loss of
324 ha of wetland.
c` Construction
of levees around swamp for flood control with no loss of wetland area.
Source: Schamberger et al., 1979.
Return to Week 5 - Lecture 2
Return to overhead index
Return to Week 5 - Lecture 2
Return to overhead index
Replacement Evaluation
Return to Week 5 - Lecture 2
Return to overhead index
Wetland Alterations
Water Level
draining
channeling
construction
of dams
filling
water
extraction
highway
construction
Nutrient Level
sewage
agricultural
runoff
sediments
Man Made Disturbances
discharge
of toxic substances
acid
mine drainage
mineral
extraction (phosphates, gravel, sand)
peat
extraction
Natural Disturbances
subsidence
drought
hurricanes
erosion
biotic
effects - "eat-outs"
Return to Week 5 - Lecture 2
Return to overhead index
Trend of Drained Agriculture Land
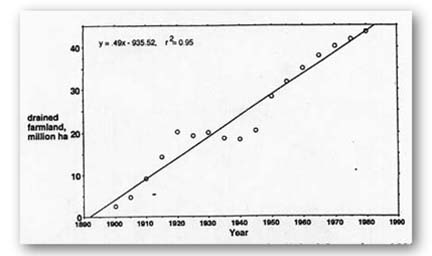 Fig. 16-3. Trend of drained farmland in the U.S. from
1900 to 1980 (Gosselink and Maltby, 1990, based on data from Office of Technology
Assessment, 1984)
Fig. 16-3. Trend of drained farmland in the U.S. from
1900 to 1980 (Gosselink and Maltby, 1990, based on data from Office of Technology
Assessment, 1984)
Return to Week 5 - Lecture 2
Return to overhead index
Historical Wetland Loss
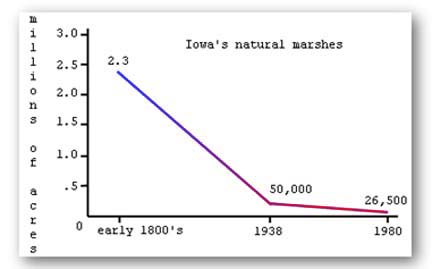
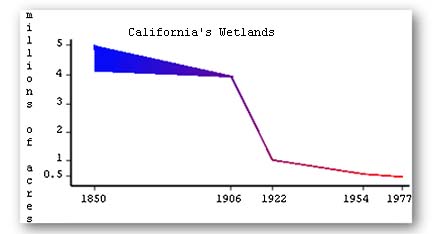 Fig.30. Historical losses of wetlands in Iowa and California.(from
Bishop 1981 and U.S. Fish and Wildlife Service 1977).
Fig.30. Historical losses of wetlands in Iowa and California.(from
Bishop 1981 and U.S. Fish and Wildlife Service 1977).
Return to Week 5 - Lecture 2
Return to overhead index
Historical Wetland Loss - Coastal
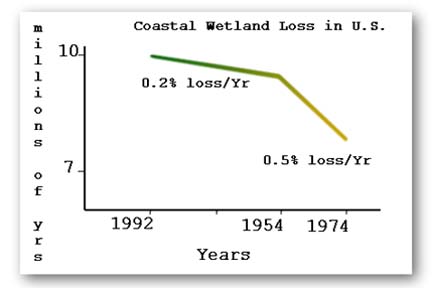 Fig 31.Rate of coastal wetland loss in the conterminous
U.S. (from Gosselink and Bauman 1990). Estimates include both estuarine
and tidal freshwater wetland losses.
Fig 31.Rate of coastal wetland loss in the conterminous
U.S. (from Gosselink and Bauman 1990). Estimates include both estuarine
and tidal freshwater wetland losses.
Return to Week 5 - Lecture 2
Return to overhead index
Coastal Wetland Conversions
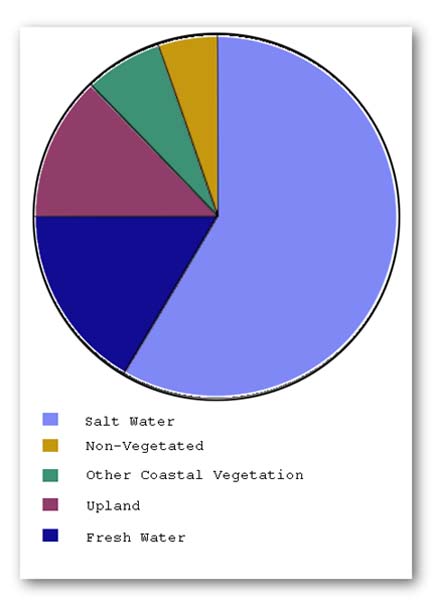 Fig 6. Fate of converted estuarine emergent(coastal) wetlands,
min-1970's to mid-1980's.
Fig 6. Fate of converted estuarine emergent(coastal) wetlands,
min-1970's to mid-1980's.
Return to Week 5 - Lecture 2
Return to overhead index
Palestrine Wetland Loss / Gain
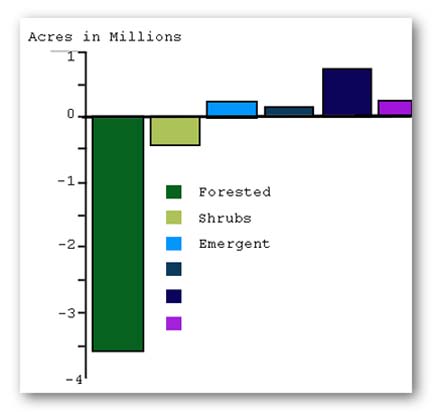 Fig.7. Palustrine wetland gains and losses, mid-1970's
to mid-1980's.
Fig.7. Palustrine wetland gains and losses, mid-1970's
to mid-1980's.
Return to Week 5 - Lecture 2
Return to overhead index
Non-Federal Wetland Loss 1982- 1987
Table 2. NRI-based
estimates of wetland area in 1982 and 1987 (in 100's of ha)
| Region |
Total Area
'82*....................'87* |
Area
lost........gained |
Retained(%) |
Net Change (1987-1982) |
Change(%) |
| West |
2628.3.........2476.7 |
157.3........5.7 |
94.0 |
-151.6 |
-5.77 |
| Midwest |
10347.3......10314.0 |
51.6........18.3 |
99.5 |
-33.3 |
-0.32 |
| Southwest |
14983.7......14847.6 |
140.2........4.1 |
99.1 |
-136.1 |
-0.91 |
| Northeast |
5531.8..........5489.6 |
43.8..........1.6 |
99.2 |
-42.2 |
-0.76 |
| Total |
33491.1......33127.9 |
393.9......29.7 |
98.8 |
-363.2 |
-1.08 |
*Wetlands that were involved in a transfer of ownership between
federal and nonfederal land are not included in these estimates.
Return to Week 5 - Lecture 2
Return to overhead index
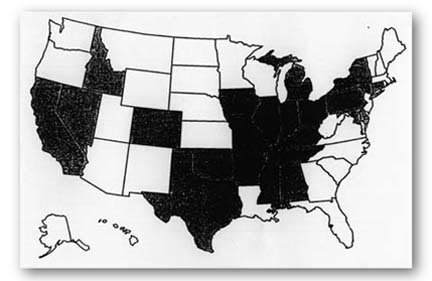
Wetland Loss in U.S.
Fig 1.States that lost
more than 50% of their wetlands between the 1780's and mid-1980's (listed
states shaded)(after Dahl 1990)
| State |
% Lost |
State |
% Lost |
| Alabama |
50 |
Maryland |
73 |
| Arkansas |
72 |
Michigan |
50 |
| California |
91 |
Mississippi |
59 |
| Colorado |
50 |
Missouri |
87 |
| Connecticut |
74 |
Nevada |
52 |
| Deleware |
54 |
New York |
60 |
| Idaho |
56 |
Ohio |
90 |
| Illinois |
85 |
Oklahoma |
67 |
| Indiana |
87 |
Pennsylvania |
56 |
| Iowa |
89 |
Tennessee |
59 |
| Kentucky |
81 |
Texas |
52 |
Return to Week 5 - Lecture 2
Return to overhead index
Total Wetland Loss
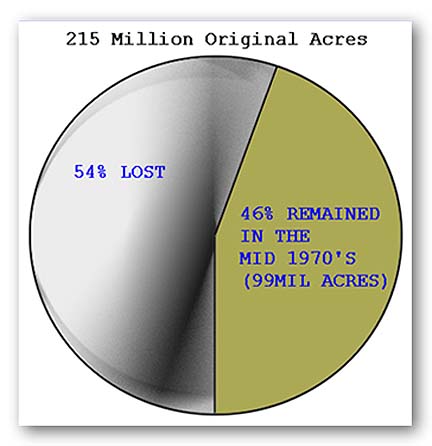 Fig 27. Original and remaining acreages of wetlands in
the counterminous U.S. (from Roe and Ayres 1954; Frayer,et al., 1983).
Fig 27. Original and remaining acreages of wetlands in
the counterminous U.S. (from Roe and Ayres 1954; Frayer,et al., 1983).
Return to Week 5 - Lecture 2
Return to overhead index
Wetland Conversions
| Uses |
1950-1970 |
1970-1980 |
1980-1990 |
| Agriculture |
87% |
54% |
37% |
| Urban |
8 |
5 |
48 |
| Open Water/Barren |
- |
- |
15 |
| Forest |
- |
- |
- |
| Other |
5 |
41 |
- |
Return to Week 5 - Lecture 2
Return to overhead index