Community Asset Mapping: Boise Neighborhood Demographics
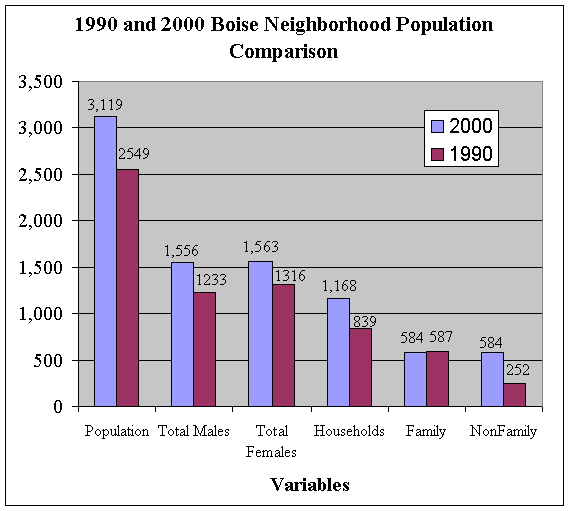
Boise Demographics: Graph 1

| Population | Total Males | Total Females | Households | Family | NonFamily | |
| 2000 | 3,119 | 1,556 | 1,563 | 1,168 | 584 | 584 |
| 1990 | 2549 | 1233 | 1316 | 839 | 587 | 252 |
Boise Demographics: Graph 2
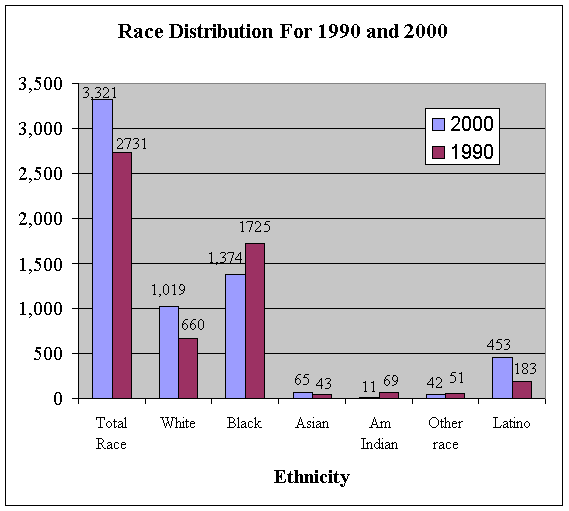
| Total Race | White | Black | Asian | Am Indian | Other race | Latino | |
| 2000 | 3,321 | 1,019 | 1,374 | 65 | 11 | 42 | 453 |
| 1990 | 2731 | 660 | 1725 | 43 | 69 | 51 | 183 |
Boise Demographics: Graph 3
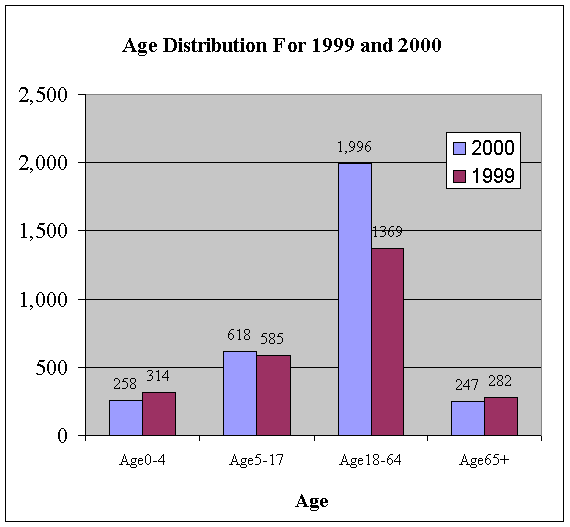
| Age0-4 | Age5-17 | Age18-64 | Age65+ | |
| 2000 | 258 | 618 | 1,996 | 247 |
| 1999 | 314 | 585 | 1369 | 282 |
Boise Demographics: Graph 4
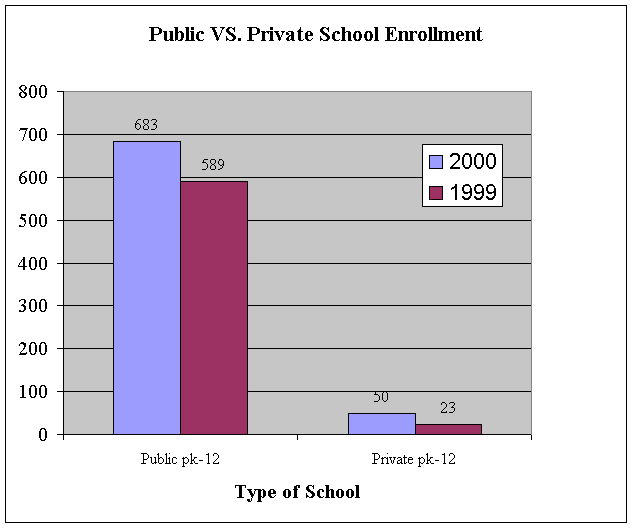
| Public pk-12 | Private pk-12 | |
| 2000 | 683 | 50 |
| 1999 | 589 | 23 |
Boise Demographics: Graph 5
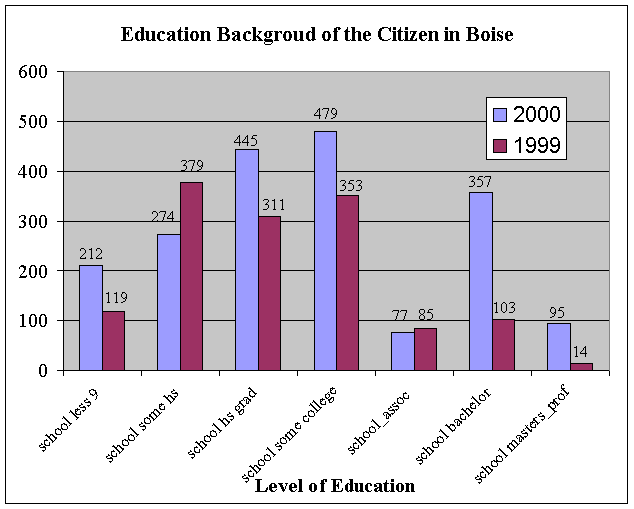
| school less 9 | school some hs | school hs grad | school some college | school_assoc | school bachelor | school masters_prof | |
| 2000 | 212 | 274 | 445 | 479 | 77 | 357 | 95 |
| 1999 | 119 | 379 | 311 | 353 | 85 | 103 | 14 |