|
G 424/524 GIS for the
Natural Sciences
D.
Percy
e-mail: percyd@pdx.edu
Quadrat Analysis
A first cut at analysing the distribution of points
You are going to compare the distribution of points with a theoretical
Poisson distribution (random) and use a Chi-Squared statistical
test to see if there is a significant difference.
These are the step-bystep instructions:
- Download the GenerateGrid script from www.esri.com/arcscripts.
Save it to your assignment 5 directory.
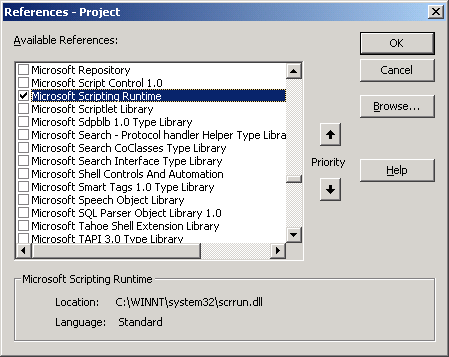
- Follow the instructions for installing it.Make sure you turn on
Scripting Runtime
- Use the this script to create a grid over the state: Tools->
Macros->Macros->modGen.GenerateGridUI, enter number of rows
and columns in subsequent dialog boxes.
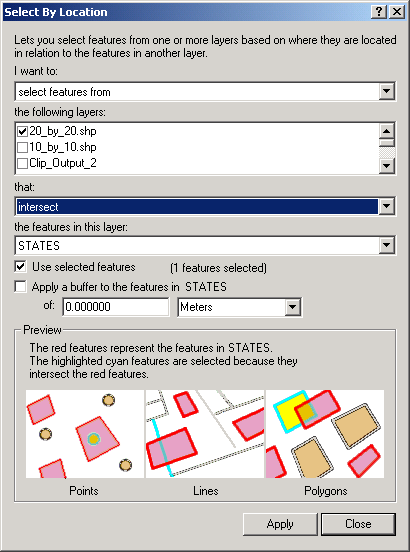
- Use the Selection-> Select by Location function to do a spatial
query of all grids that intersect the state (assuming that you drew
your box larger than the state). Your screen might look like
this. Save this as a new theme. We won't worry about the boundary
problem.
- Choose the oregon_earthquakes theme and do a spatial join to the
intersected grids theme (from the previous step).
- Open the table (Join_Output), right-click on the field Name and
choose Summarize. Accept the defaults in the dialog box. This gives
you a table of how many earthquakes occured in each grid cell.
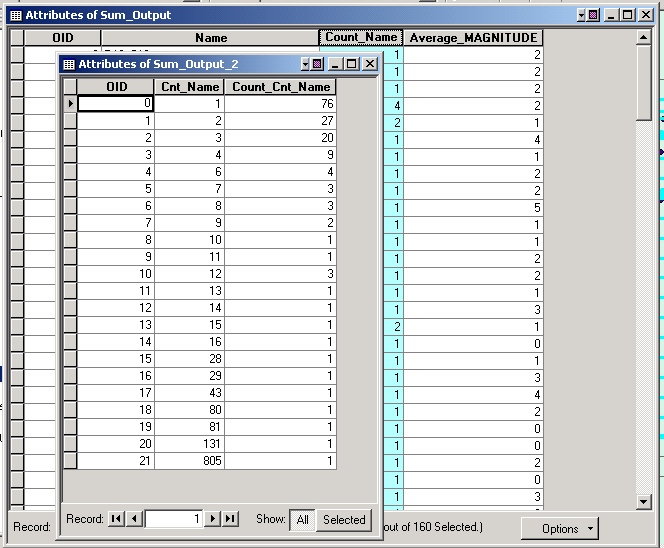
- Summarize this table in the same way that you just did, but this
time summarize on the field Count_Name. This gives you a list of
how many cells had 1 earthquake, how many 2 earthquakes, etc. It's
a little confusing because the fields are both named variants of
Count. Just remember that the first count is "how many earthquakes
in a grid", the second is "how many grid cells are like
that". Your screen might look like this.
- Export the summarized table to DBF so that you can import it to
Excel. (actually, you can just open it directly in Excel without
exporting, just keep track of the filename, like Sum_output2.DBF).
In Excel, change your filetype to Dbase in the Open Files dialog
box.
- The number of cells that had zero earthquakes is equal to the
total cells minus cells that had quakes. Duh :-)
- Download my Poisson example spreadsheet.
For a quadrat analysis you need to have at least 5 events in a category.
You will probably combine all of the categories above a certain
value. For my 50 x 50 example I combined everything greater than
5. Remember that the sum of all probabilities in the Poisson distribution
is 1. The sum of the Expected and Observed should both be the total
number of quadrats that intersected Oregon.
- Alter the spreadsheet to accomodate the grid size that you used.
Your Chi Square value should be VERY large, since this is obviously
a clustered data set!
Now join the summarized table from step back to your grid table (use the
LABEL field) so that you will have a list of all the grid cells and how
many earthquakes are in each. Now you can plot a graduated color map of
earthquake occurence, which will be visually less busy than plotting all
of the earthquakes. Cool, huh? |