Air Quality 2 -
Determination of Cd and Pb by Anodic Stripping
Voltammetry
Introduction:
In the first experiment of this set, you measured the concentration of
benzene in gasoline, and it is a reasonable assumption that some fraction of it
ends up in the air we breathe. Benzene is one of the air toxics that were
considered in a recent assessment conducted by the Oregon Department of
Environmental Quality (for further information, go to http://www.deq.state.or.us/aq/toxics/).
Another air toxic (chemical compound in air that can lead to public health
problems) that was identified as a possible concern is cadmium, a metal that is
generally found in the ionic state (Cd2+) in the aerosol phase. Aerosols are a mixture of
air and particles that can be solid or liquid, but in this case, the cadmium is
attached to micrometer-sized (or smaller) solid particles that can remain
suspended in the air for hours to days in the urban area. For this experiment,
we will use a filter-sampling apparatus to collect aerosol samples that we will
analyze by anodic stripping voltammetry. We will also determine lead in the
aerosol samples, since it is another known metal air toxic (neurotoxin) that
can come from industrial sources, or re-suspended road dust (left over from the
days when lead was added to gasoline). Finally, we will measure the cadmium and
lead in a sample of drinking water, for general interest’s sake.
This electrochemical
experiment uses the principle of voltammetry,
where the voltage of a three electrode cell is controlled to produce an
oxidation or reduction and the current transferred in that process is measured.
In many voltammetric methods, the current is directly proportional to the
concentration of the analyte in solution. Stripping methods attain far greater
sensitivity (lower limit of detection) by pre-concentrating ions from solution
first (called the deposition or plating step) and then measuring the current
when they are re-oxidized from the surface of the electrode or from a thin film
on the surface. In principle, all of the ions from a solution could be
deposited onto the surface of the electrode, allowing each analyte molecule to
contribute to the signal (but this is impractical because it would require a
very long deposition time with vigorous stirring).
Voltammetric methods are
described by the voltage vs. time waveform (see Figure 1) used for the
experiment and the anticipated current vs. time response.
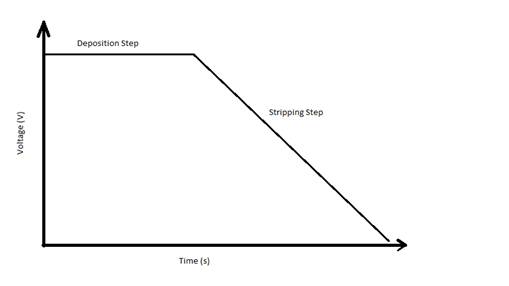
Figure
1 the voltage vs. time
waveform for anodic stripping voltammetry.
Typically these results
are combined and presented as a plot of current vs. voltage, known as a
voltammogram (see Figure 2). In Figure 1, the deposition step is a constant
large negative voltage (in voltammetry, the x and y axes are often backwards
from usual, with increasingly negative voltages going up or to the right*) that
reduces all of the metal ions in solution to metal atoms. The metal atoms
either plate onto the electrode surface or are dissolved in a thin mercury film
(many metals form stable amalgams with mercury) leaving them available for
re-oxidation. As the voltage is rapidly scanned toward more positive values
during the stripping step, individual ions strip back off the electrode at
their oxidation potential resulting in current peaks for each of the metals
(Figure 2). This allows multiple metals (usually up to three or four) to be
determined in a single analysis, as long as their concentrations are similar
(so they don’t require very different deposition times). {The voltage waveform
that is actually used in this experiment is a little more complicated, but
contains the essential features in Figure 1 – to document the actual waveform,
double click on the CH427PbCdexpt run configuration icon at some point during
the experiment and either take notes on or print out the figure in the top
middle. Be careful that you don’t change anything – it is best to click
“cancel” when you are finished.}
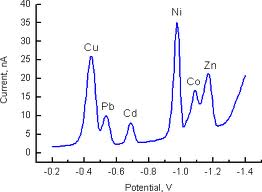
Figure
2 an example of an anodic
stripping voltammogram for a mixture of metals. Peak height or area can be used
for quantitation of the various elements.
*The presentation of the
voltage waveform and voltammogram here is similar to that in Skoog, et al. but the VAS software uses the other
convention, where increasingly negative voltages are down and to the left, as
you would normally do when making a plot.
Apparatus
1 - 20 μL automatic pipettor (1)
20 - 200 μL automatic pipettor (1)
1.00 mL vol. pipet (1)
10.00 mL vol. pipet (2)
10 mL graduated cylinder
ASV sample cups
Ultrasonic bath
Aerosol filter sampler
Instrumentation (See
Appendices for Operating Instructions)
Cogent/Modern Water PDV
6000 plus and VAS software
Solutions to be prepared
(or obtained)
Electrolyte and standard
kit from Cogent/Modern Water, Inc. If necessary, prepare CLAC electrolyte by
dissolving one CLAC Electrolyte
Concentrate into one Electrolyte
Diluent A (cap and shake until concentrate is
fully dissolved).
Procedure
(1) Collection and
Extraction of Aerosol Filter Sample:
Do this part of the procedure well
before you do the laboratory experiment.
·
Place a filter into the plastic Buchner funnel and support the funnel so
that it is up off the ground and away from walls and other surfaces.
·
Turn on the pump and adjust the flow to 20 lpm.
·
Record the start and stop times for the sample and any other key variables
(proximity to traffic, meteorology, etc.)
·
Remove the filter and wrap it in aluminum foil.
If you are going to analyze a cigarette sample (tobacco or ash) or a
smoke filter sample, you will follow the extraction procedure below to prepare
the sample for analysis.
Do this part of the procedure in the
fume hood near the ASV at the beginning of the lab period when you will be
analyzing the samples using ASV.
·
Prepare a 10 mL graduated cylinder with ~ 1.5 M nitric acid: fill to 9 mL
with DI water and carefully add 1 mL of concentrated HNO3.
·
Place the filter in the bottom of a 100 mL beaker and add the nitric acid
solution.
·
Carefully place the beaker in the ultrasonic bath with just enough water
to avoid floating the beaker and agitate for 15 minutes.
·
Remove the filter from the beaker using a stir rod and neutralize it in a
small beaker half-filled with sodium bicarbonate before placing it in the solid
waste container.
·
Put the beaker near the center (inward) of the hood and carefully add 3 solid sodium hydroxide
pellets. Swirl until the pellets dissolve.
·
Cover the beaker with parafilm until you are
ready to do the analysis.
(2) ASV Measurement
of cadmium and lead in water sample using Standard Comparison (SC): Important! Do not turn on the PDV6000plus
without placing the electrodes in a sample cup containing a suitable
electrolyte. The resulting voltages can damage the Working Electrode. See the
Appendix for further information.
The World Health
Organization has recommended water quality standards of no more than 3 ppbv cadmium and 10 ppbv lead. We
do not expect your drinking water to contain anything close to those levels, so
we will conduct a screening (rather than a proper determination) on this
sample. Because your water sample has very little electrolyte (and ASV requires
a supporting electrolyte) we will compromise between providing an electrolyte
and diluting the sample with it – i.e., we will add of 10.00 mL of the water
samples to 10.00 mL of the CLAC electrolyte in a pre-labeled ASV measurement
cup. The Standard Comparison standard
will be 20.00 mL of CLAC electrolyte with 40 µL of a 10 ppm lead/cadmium
standard (to produce a solution with 20 ppbv Cd and
20 ppbv Pb). Note that your
values for the water samples may fall outside of the SC confidence range and
that will be indicated by a “<” in front of the number or just a zero
reported concentration.
(3) Prepare a set of
three challenge “unknown” samples: 1) a nominal 10 ppbv
Cd “unknown”, 2) a nominal 10 ppbv Pb “unknown”, and 3) a solution nominally containing both
10 ppbv Cd and 10 ppbv Pb. These solutions are to be produced by appropriate
dilutions of the 20 ppm Cd and Pb standards in the
CLAC electrolyte to produce 20 mL of solution in pre-labeled ASV measurement
cups.
Remember to create a new sample file between each measurement (SC
vs. SA and challenge vs. real unknowns)
(4)
ASV Measurement of cadmium and lead in challenge and aerosol samples
using Standard Addition (SA):
The Appendix assumes
that you are analyzing the aerosol sample first, but you may find it easier to
analyze the challenge “unknowns” first, since you know their concentrations and
thus the logical size of the spikes. (And it is encouraging to start with
solutions that actually give results.) If so, remember to rinse the cell at
least three times between each sample and the next blank (there isn’t a standard run in SA, so you don’t have
that extra rinse step). For the single metal challenge unknown samples (Cd or Pb only) it obviously makes more sense to use the single
metal standards (which are 20 ppm) to do the spikes.
The concentrations of
lead and cadmium in atmospheric aerosol are highly variable and sometimes very
low. So the first thing we will do to improve our chances of seeing the metals
is increase the deposition time to 5 minutes. Double click on the CH427PbCdexpt
run configuration icon and change the deposition time from 180 seconds to 300
seconds and set the configuration as active. (We don’t do this for all the
samples because it takes too long. Make sure you change back if you run the
challenge samples after the aerosol sample.) The beauty of the standard
addition procedure is that you run the sample first (after a blank) and if
there is no measureable concentration of one or both metals, it will be readily
apparent. If this is the case, you should still do two 10 ppbv
spikes to establish the limit of detection for the method. You will then be
able to report the metal(s) as a non-detect and provide an upper limit for the
concentration. Optimally, spikes should be added that are individually smaller
than the concentration (~ 50% or more) but enough spikes should be used to more
than double the original concentration, clearly establishing the analytical
sensitivity (the slope of the - hopefully linear - SA curve). If the lead and
cadmium concentrations are vastly different, it may be easier to do the SA
procedure for each separately, using another 1 mL of the extractate to prepare
another sample. Be sure that you take careful notes on what you actually do,
and document your procedure in the
Experimental section of your report.
Report: In preparing your Final Report, you should
consider/complete/discuss the following (not necessarily in this order):
(1) Comment on the voltammograms and whether you
see any shifts in the peak positions for either metal. These shifts are
sometimes seen with concentration (for some metals) or more commonly with
“real” samples, where the metals may be partially complexed.
(2) Present and comment on the appearance of the
standard addition curves. If they are not linear, estimate a corrected value(s)
for the unknown(s) based either on a smaller number of spikes or a non-linear
fit to the data (note the peak heights and areas are provided in the Results
item).
(3) Comment on the accuracy of the SA method,
based on the challenge unknown results. What is the relative accuracy of this
version of ASV? Is this acceptable for environmental applications (in your
opinion)?
(4) If any of your samples (water or
aerosol) contains measureable levels of lead or cadmium, calculate the relevant
concentration. (For any values that are below the measurement threshold, state
the result as a non-detect with an estimated LoD.)
For water samples, simply apply any relevant dilution factors. For the aerosol
samples, you can report micrograms per cubic meter of air, based on the total
metal mass in the sample and the volumetric air flow through the filter (20
L/min) multiplied by the total sampling time. Comment on the values, but don’t
be too worried for your health, there is ample opportunity for contamination in
this procedure.
Revised 2014-1-21 DBA