FIGURES OF THOUGHT:
THE USE OF DIAGRAMS IN TEACHING SOCIOLOGY*1978
College teaching is most often practiced in the form of talk. Instruction as talk can be likened to the activity of taking apart a castle, stone by stone, and shipping it from Europe for re-assembly in America. In this simile the castle represents a set of ideas or concepts, simple or complex, which reside in the mind of the instructor. This conceptual knowledge is broken down, packaged in small, intricate verbal containers for shipment to the New World of the student's mind in hortatory, wind-powered vessels known as lectures. In this process one major difficulty stands out. While the dis-assembler—the instructor—sees in his or her mind's eye how the finished castle looks, understands its floor plan, rummages comfortably in its ancient rooms, and knows in what sequence the pieces are best shipped, the re-assemblers—the students—know none of this. If they did, instruction would be largely redundant. A central challenge and dilemma of teaching is in providing students with the intellectual blueprints for assembling a conceptual edifice whose form cannot truly be known until all the forthcoming separate bits of knowledge are back in place.
Conceptual wholes—often the most important accomplishment of learning--are difficult to grasp in these bits and pieces of language. Diagrams—figures of thought drawn on the chalkboard—can play a central role in facilitating the process of re-assembly. While teachers often utilize the chalkboard as a memory device for note taking, they much less often plan its use as a stimulating visual aid. Planned, drawn-out diagrams can productively accompany the audible words of explanation much as music accompanies a song. Such diagrams provide suggestive maps, visual aids, and blueprints helping students to reassemble all those divergent words into new and complete conceptualizations.
The use of diagrams in teaching has received indirect support in the recent work that has revealed a functional asymmetry of the human brain and its internal processes. Biological and behavioral scientists are now convinced that the two hemispheres of the brain generally emphasize and even specialize in different styles of perception and cognition (Ornstein, 1973; TenHouteh and Kaplen, 1973; Jaynes, 1976; Wittrock et al., 1977; McConnell, 1978). Most typically the left side is considered to be linear, rational, and linguistic in emphasis, while the right side is more holistic, intuitive, and "gestaltic."1
A short leap of the imagination (either logical or intuitive) suggests that more learning would take place if teaching were directed simultaneously toward both hemispheres of the brain. A student would then be exposed to forms of information which appeal to both modes of brain functioning. One could legitimately suppose that information would then be "synergized" by the brain, with information from each side interacting with and supplementing that from the other. The result should be a whole greater than the sum of its parts. Indeed, this does characterize those rare moments of real insight—the "Aha" or "Eureka;" experience (see Koestler, 1964). Recently, Wittrock (1977) has suggested that promotion of such generative imagery" be formally incorporated into the educational system.
The styles of accomplished teachers may also reflect this dualism. Such teachers do more than address the linguistic side of the brain. In fact, the ability of teachers to operate in both these styles at the same time makes their physical presence indispensable to the occurrence of real, (as opposed to apparent) learning. When teachers both speak and diagram or otherwise provide visual imagery, they appeal to both sides of the brain simultaneously and communicate more fully to each student's capacities for understanding. McConnell (1978) describes his discovery of this process most explicitly in his realization of an "ideal textbook."2
An appropriate diagram may help the right-brain to "inform’’ the left-brain what sense to make of those many separate, incoming words. Howard Higman (1976) has said of this bilateral process that "The right-brain knows what [the learning] is but can't say it; the left brain can say it but doesn't know what it is yet." A well presented, dualistic approach seems to help resolve this problem (see McConnell, 1978:165).
Another reason to use diagrams is the additional dimension of the presentation itself--that of dynamic movement--easily made present in the classroom, but difficult to "represent" here within the constraints of the written word. In Mehrabian's (1968) highly instructive investigation into the types of communication typical of face-to-face interaction, 56% was non-verbal and 37% was non-linguistic in nature. Even it only approximately accurate, these are striking proportions. They constitute a powerful argument for the deliberate inclusion of much more than words in the classroom. Again this is a forceful argument for the physical co-presence of teacher and students. A diagram actively presented by the teacher is drawn on the chalkboard—it emerges in front of the students, before their very eyes. It can be expanded, elaborated, amended, reiterated, erased, redrawn. In addition, it can be informed or expanded upon by the ways it is physically drawn out and expounded upon, by the very way it is "leaned into" with body English.3
Diagrams can run from simple to intricate, from easy to ornate. Those that are presented here are arranged in order of increasing complexity. In my own teaching I have found that a particularly effective or useful diagram often becomes elaborated upon as it is repeated. In some instances I have remained after class to copy my own efforts at diagrammatic thought from the chalkboard. These diagrams are "figures of thought " that have worked well for me. While the dynamic process of presentation cannot be illustrated, readers are encouraged to imagine their own articulation of expressive movement. To provide aid in doing this, some of the diagrams have an indicated beginning point and each has an accompanying text explaining how it might unfold through an intrinsic logic of development. The way the diagram "figures out" on the board is intended to parallel and reinforce the development of the ideas and concepts themselves.
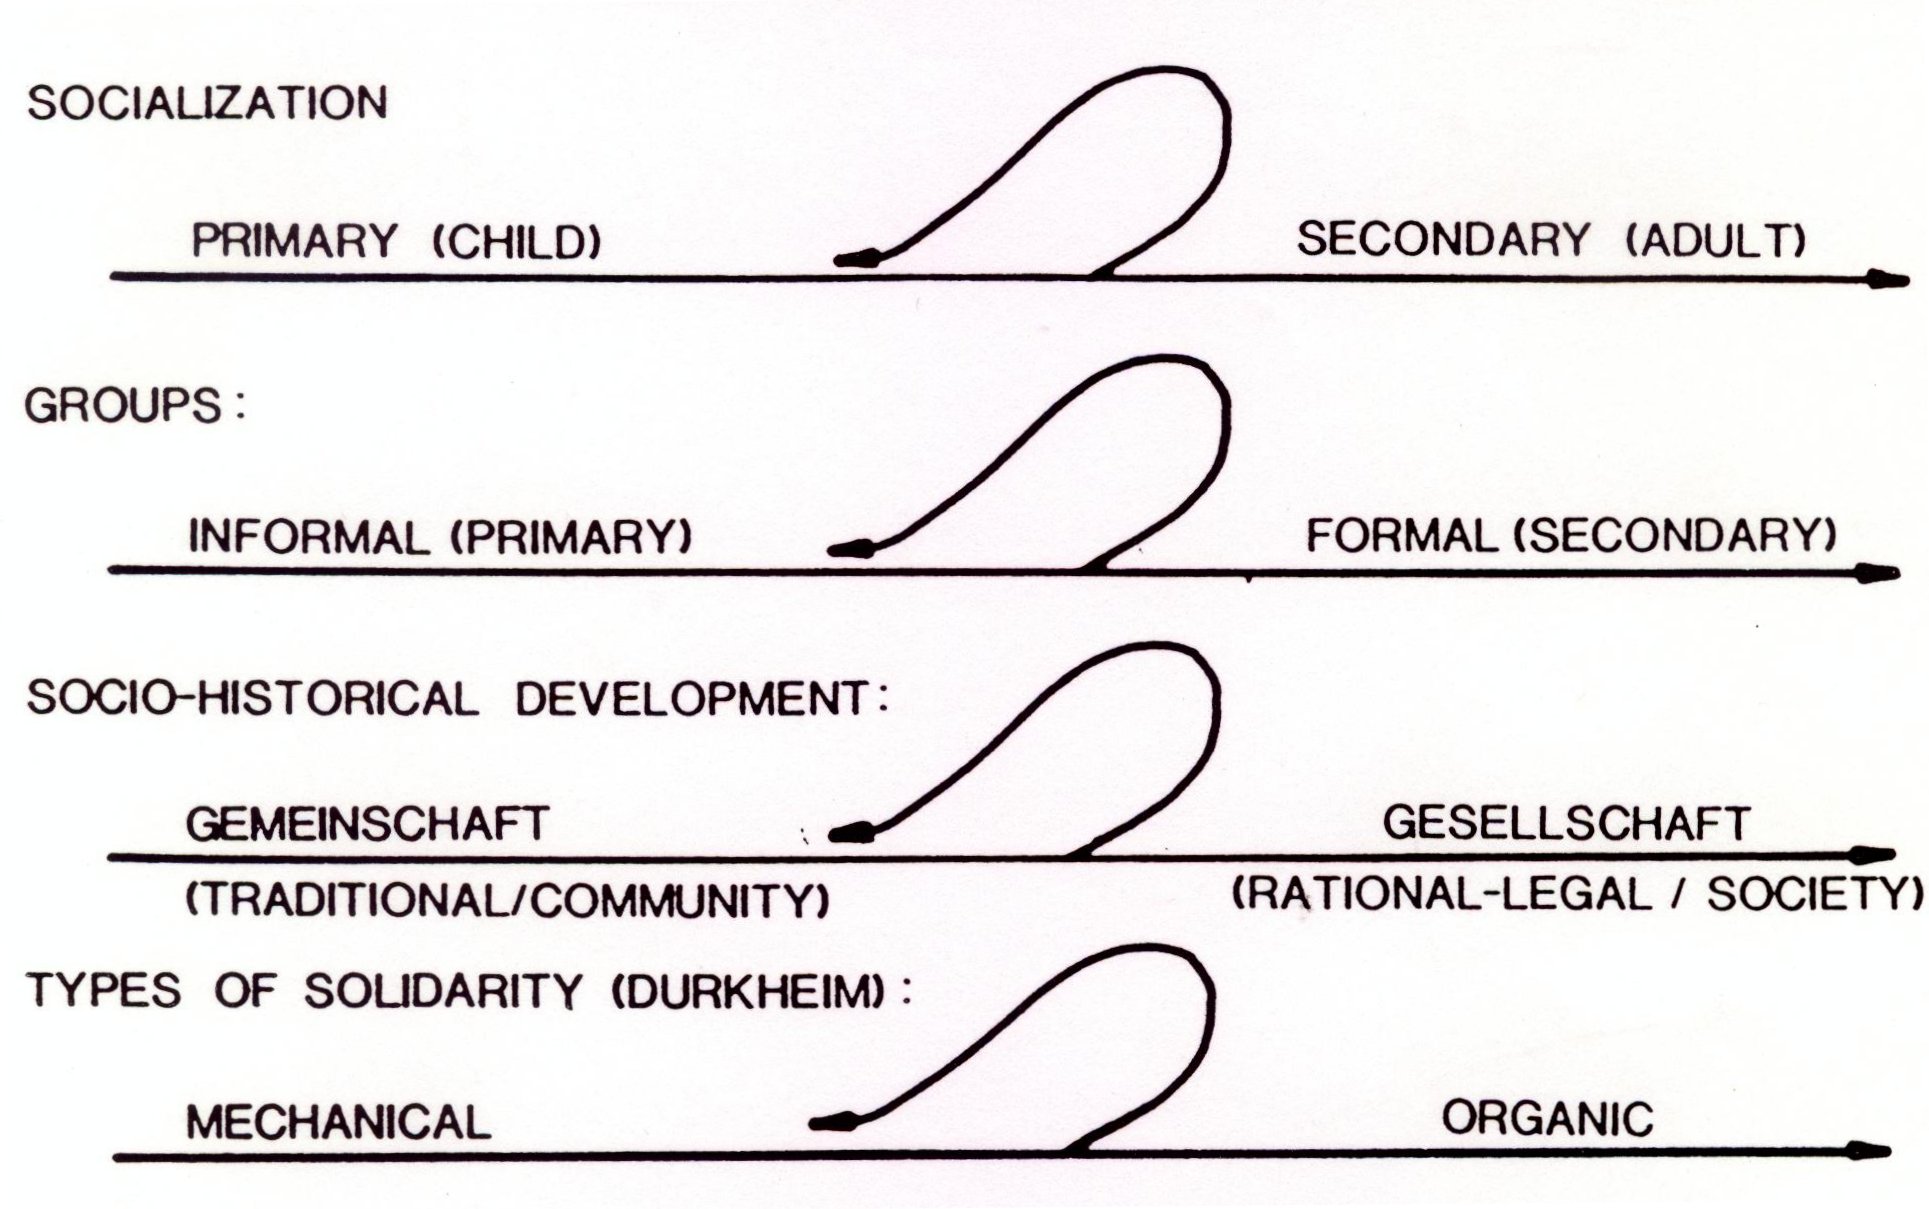
The first two diagrams are quite simple. Basically straight lines, they demonstrate how clearly and powerfully diagrams can serve to illustrate ideas. Diagram I shows how a number of different ideas in sociology are characterized by similarity of form. The parallel presentation relates ideas to one another, suggesting how one may help in understanding others.
DIAGRAM I
Drawing each line out from left to right suggests the temporal movement. Drawing all four lines prior to discussion indicates the parallelism among the various ideas. The curling lines indicate recapitulation can be done after the poles of each continuum are identified, suggesting a dynamic running counter to both biography and history and yet inherently part of both. A variety of other ideas in sociology can be located within this diagram, e.g., Homans description of internal group structure emerging out of the external social context, C. Wright Mills’ intersection of biography and history.Instructor’s Note:
Reading from left to right in Diagram I, each straight line headed by an arrow suggests change/development, or movement, while the line curling back illustrates a dynamic of recapitulation or return. Individuals move through their own biographies and through their own increased participation and involvement in secondary groups; organizations develop from simple primary groups into formal organizations; society moves through an historical shift from small, rural, traditional arrangements into large, urban, bureaucratic ones. Each instance shows a time-related development of increasing complexity and depersonalization together with an earlier social form and the recreation of that form in the newer setting. Individuals experience nostalgia, repeat in later life the patterns of their parents, and often recreate in their families of procreation experience valued in their families of origin. Complex and bureaucratic organizations find their members combining together in smaller, more personal groups whose informal controls exert as much or more influence upon individuals than rules, regulations, and rewards of the organizations themselves. Modern society repeatedly spawns groups of disaffected "retreatists" or "rebels" who strive to return to some idealized version of an earlier, happier form of social life. Durkheim's analysis and concern with the shift from mechanical to organic solidarity may illuminate much more than he knew to suggest.
DIAGRAM II
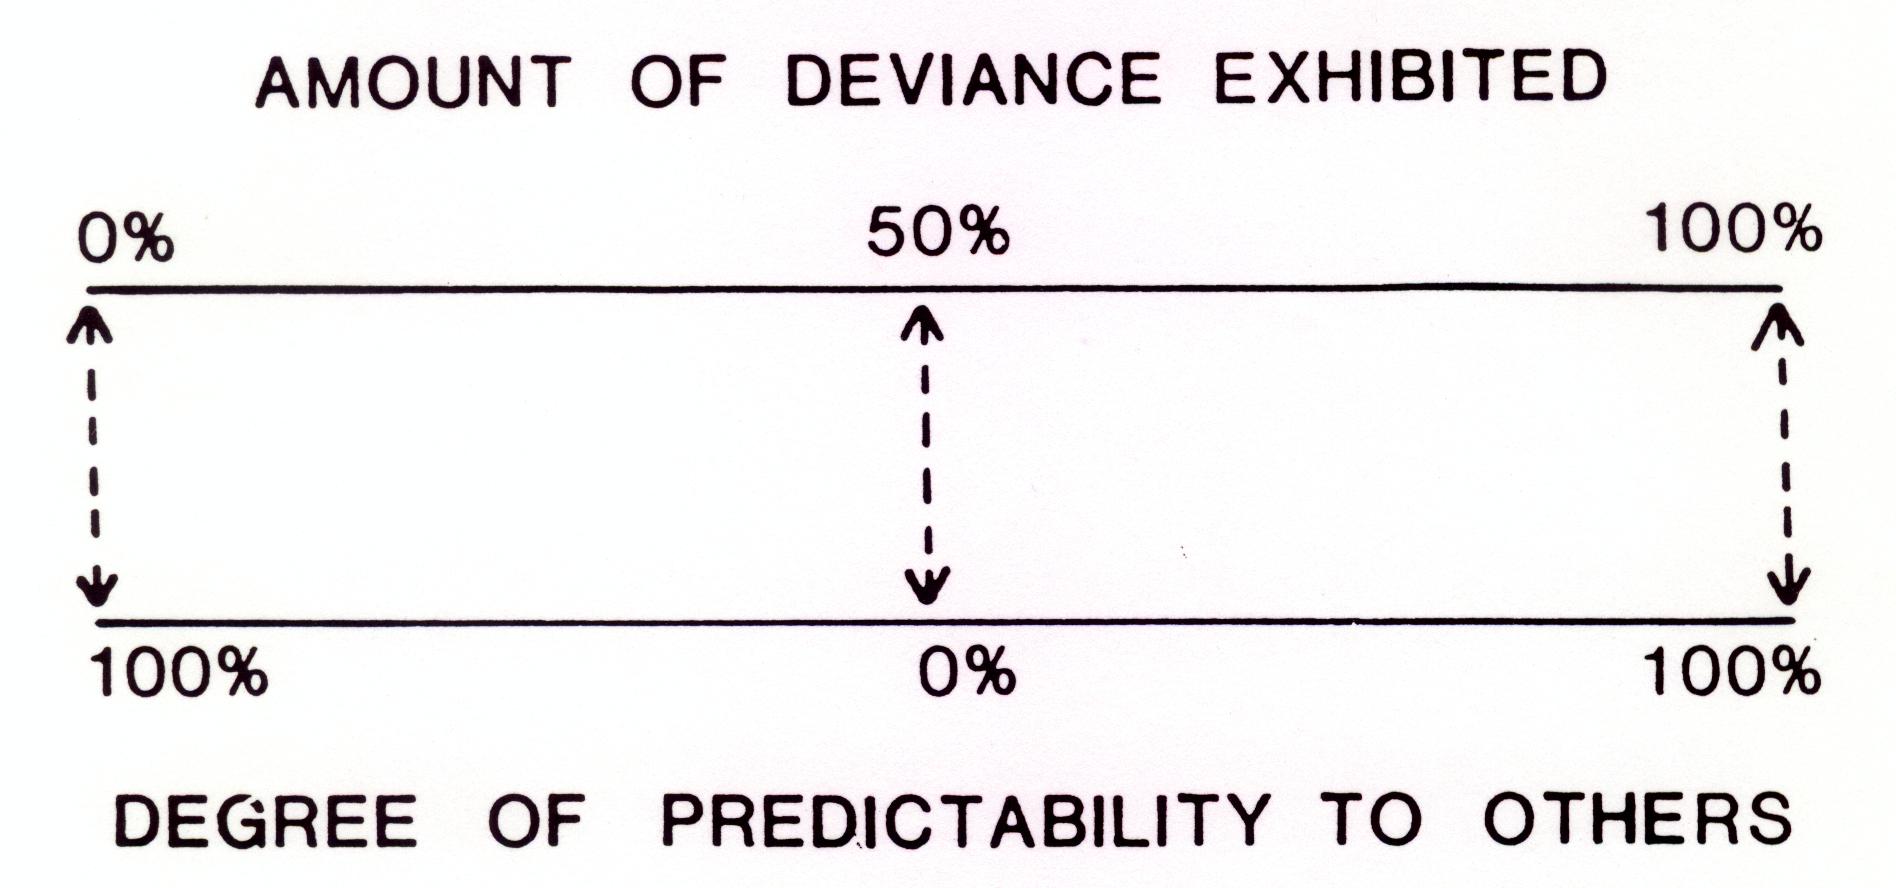
This is a relatively static diagram. However, it can be presented without the percentage figures along the bottom dimension (degree of predictability). Students can then be asked to guess at the missing figures. This provides a natural lead-in to discussions of labeling theory, how stereotypes work (as well as their function), the self-fulfilling prophecy, and so on.Instructor’s Note:
Diagram II presents an analytic relationship between variables with a simple pair of parallel lines. It illustrates how the amount of an individual's deviant behavior affects his predictability to others, which in turn may influence his identification by them and eventually affect his self-image. As the amount of deviant behavior increases from 0% to 50%, the individual's predictability declines from 100% to 0%; as the amount of deviant behavior increases from 50% to 100%, the individual's predictability returns. The two most predictable types of people, therefore, are those who never act in deviant ways and those who always act in deviant ways. Contained within the diagram is an argument, readily grasped by students, as to why deviant behavior may be initially overlooked or minimized, but upon recurrence may quickly come to be exaggerated or overemphasized by others. Both reactions are in the interests of social predictability, neither having much to do with the individual or the behavior itself. In this way the diagram additionally attests to the idea and significance of the difficult concept of social structure.
DIAGRAM III
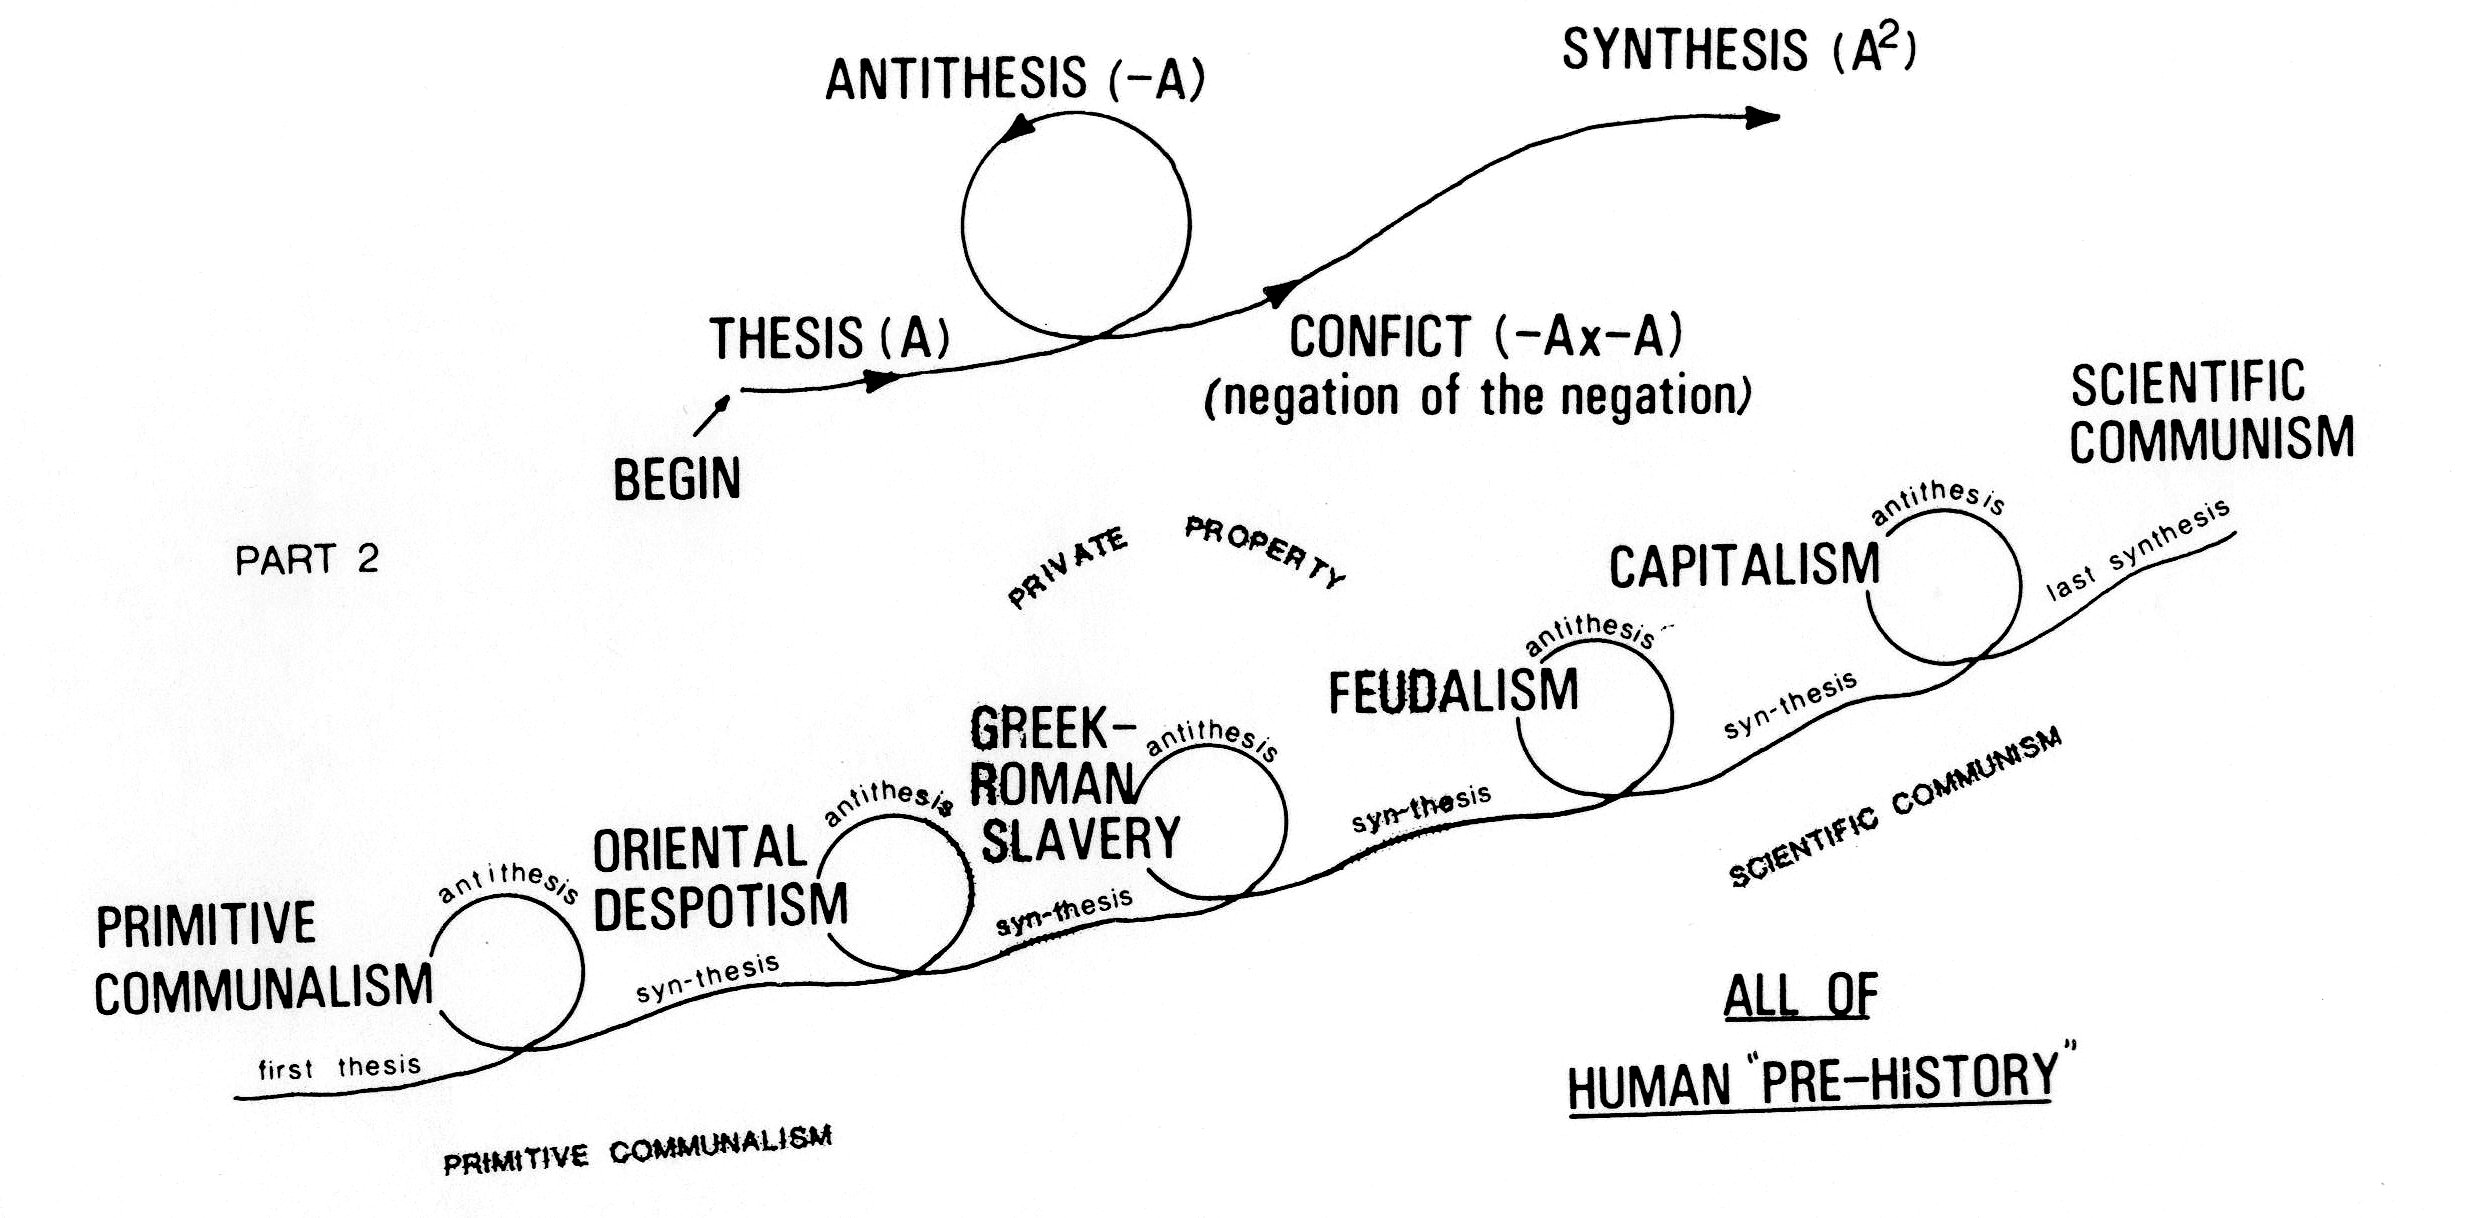
The dialectic lends itself marvelously to being drawn out as the students watch because by doing so you can demonstrate some of its inherently dynamic and dramatic qualities. The thrust of the diagram is simultaneously forward and upward, indicating both historical movement and human betterment. The form clearly shows how the antithesis flows out of the thesis, comes back against it in conflict, and then recombines to create the synthesis, which in turn becomes the thesis of the next stage of development. The teacher should inform this diagram with bold and vivacious body movement, indicating the energy of the dialectic process.Instructor’s Note:
Diagram III consists of two parts, both of them illustrating Marx's concept of the dialectical process of history. Part I is a rendition of the basic elements of the dialectic: thesis, antithesis, and synthesis, with the conflict between the thesis and its derivative antithesis identified. The negation of the legation can be demonstrated in the process leading to the synthesis, as follows: the thesis (A); followed by the antithesis, or negation of the thesis (-A); and then the synthesis, arising out of the negation of the negation (-A x -A = A). This, of course, is Engel's illustration. The idea of emergence and the idea of conflict leading to positive results both gain credibility. Part 2 of the diagram illustrates both the larger dialectical sweep of history and the more specific integral series of dialectical stages with which Marx described world history.
These are diagrams that acquire additional meaning in the process of drawing because dynamic dimensions are added to them as these spirals are chalked onto the board, moving forward and upward in bold motions. It is also provocative to diagram current history in this dialectical form. For example, thesis: masculinity/male domination; antithesis: feminism/the feminist movement; synthesis: androgyny or sexual equality or parity. Another
illustration is the civil rights movement--thesis; white racism; antithesis: black power; synthesis: affirmative action or racial pluralism, etc. Both these examples are especially amenable to more detailed examination in accordance with the model. Students begin to appreciate the dialectic as they attempt to apply it, especially to their own observations, often in quite imaginative ways.DIAGRAM IV
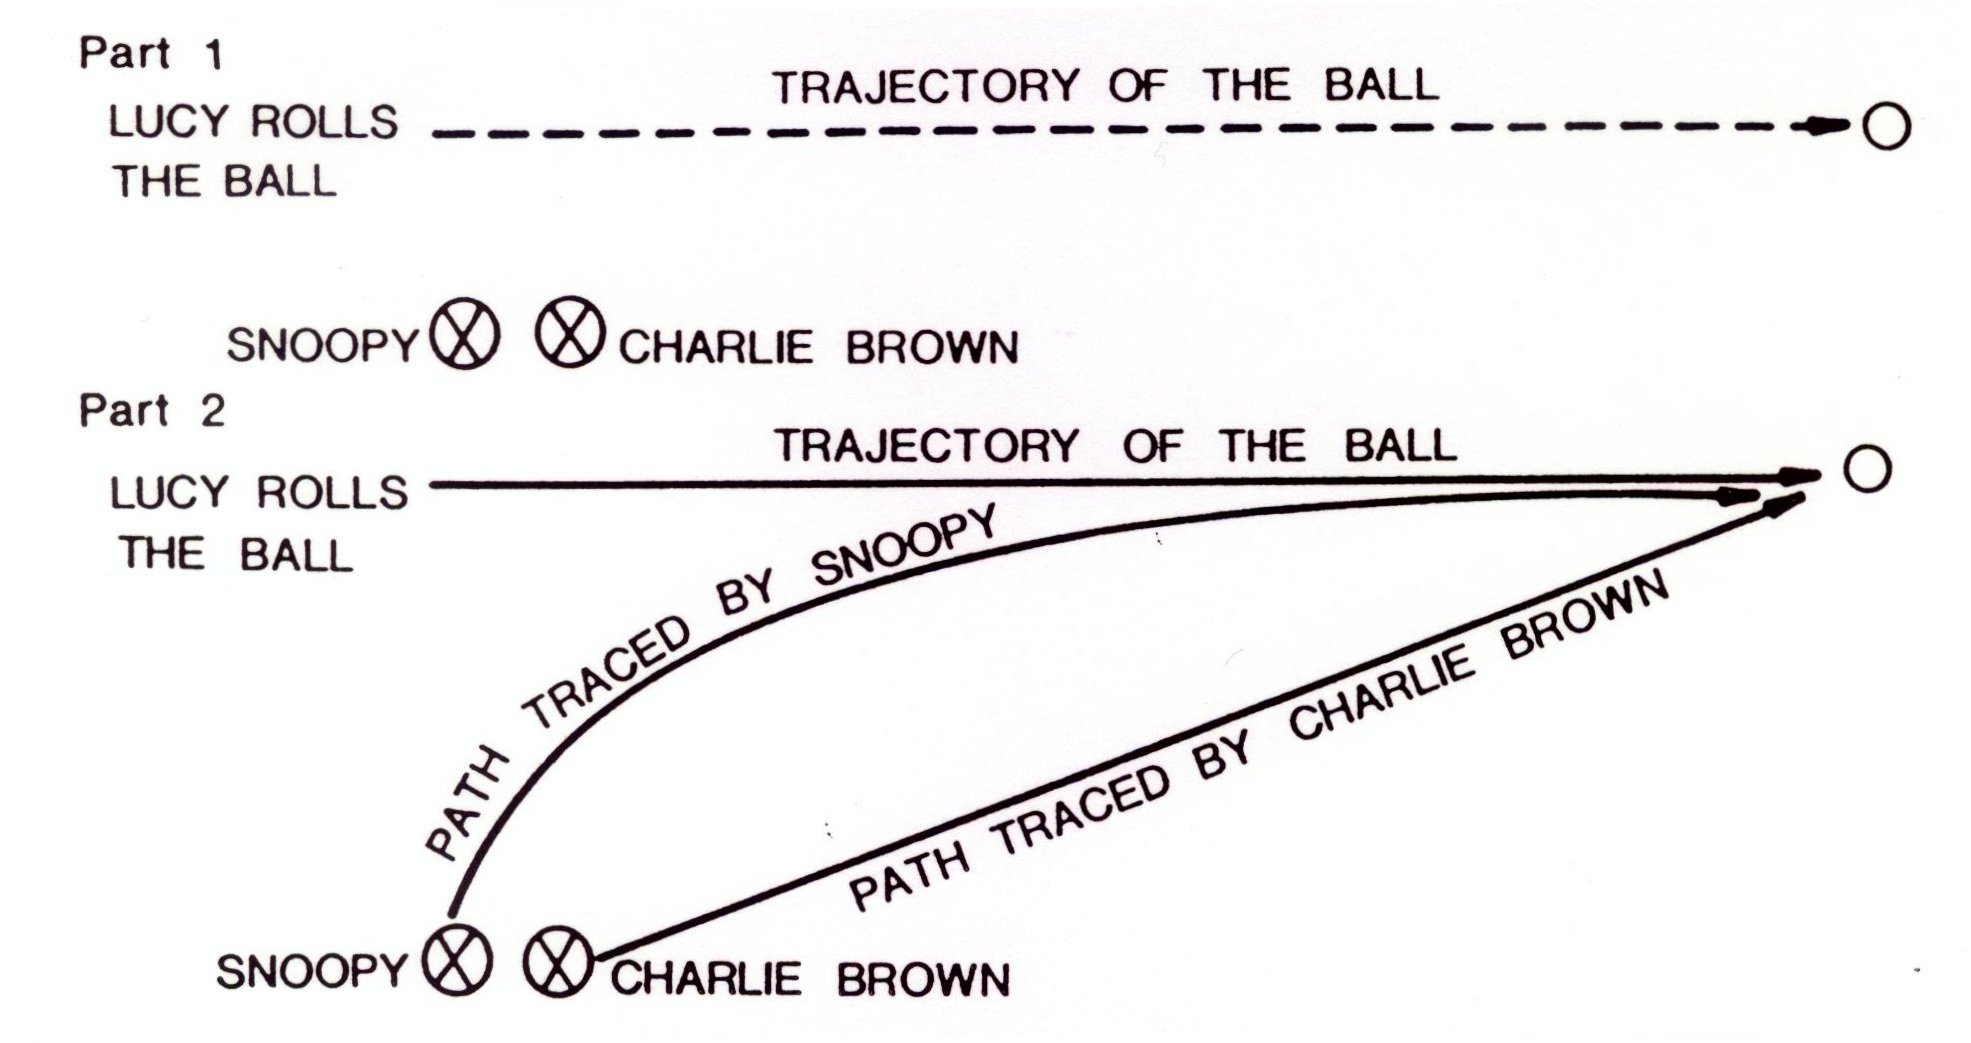
Part1 is drawn out first to pose the question. Part 2 shows how students typically complete the diagram. One approach is to draw out both paths as the students provide directions. An alternative is to have one student representing Charlie Brown and another representing Snoopy each draw out the two imagined pathsInstructor’s Note:
Diagram IV and V are used as question posing devices. Although they frame essentially rhetorical questions, presenting them in diagrammatic form does not provoke the hostility or indifference usually associated with such questions. Diagram IV s adapted from David Sackler (1975). Students are asked to draw the lines indicating the respective paths that Snoopy and Charlie Brown would take as they each attempt to catch Lucy's fast-rolling ball. Part 1 represents the initial situation; Part 2 demonstrates how students typically complete the diagram.
The major issue is what explains such a difference between the two paths? Completed by the students themselves, the diagram acts much like an experiment or demonstration. It dramatically displays a summary of their own collective insight or knowledge. Snoopy is always chasing where the ball is at any given moment, while Charlie Brown, taking into account projected future positions of both the ball and himself relative to it, runs to here the ball is going to be. This demonstration can be used to illustrate Mead's concepts regarding the internal symbolizing activity of the human mind and the central importance of a self -referent symbol. It also suggests why animal experiments may be misleading when used to explain human behavior.
DIAGRAM V
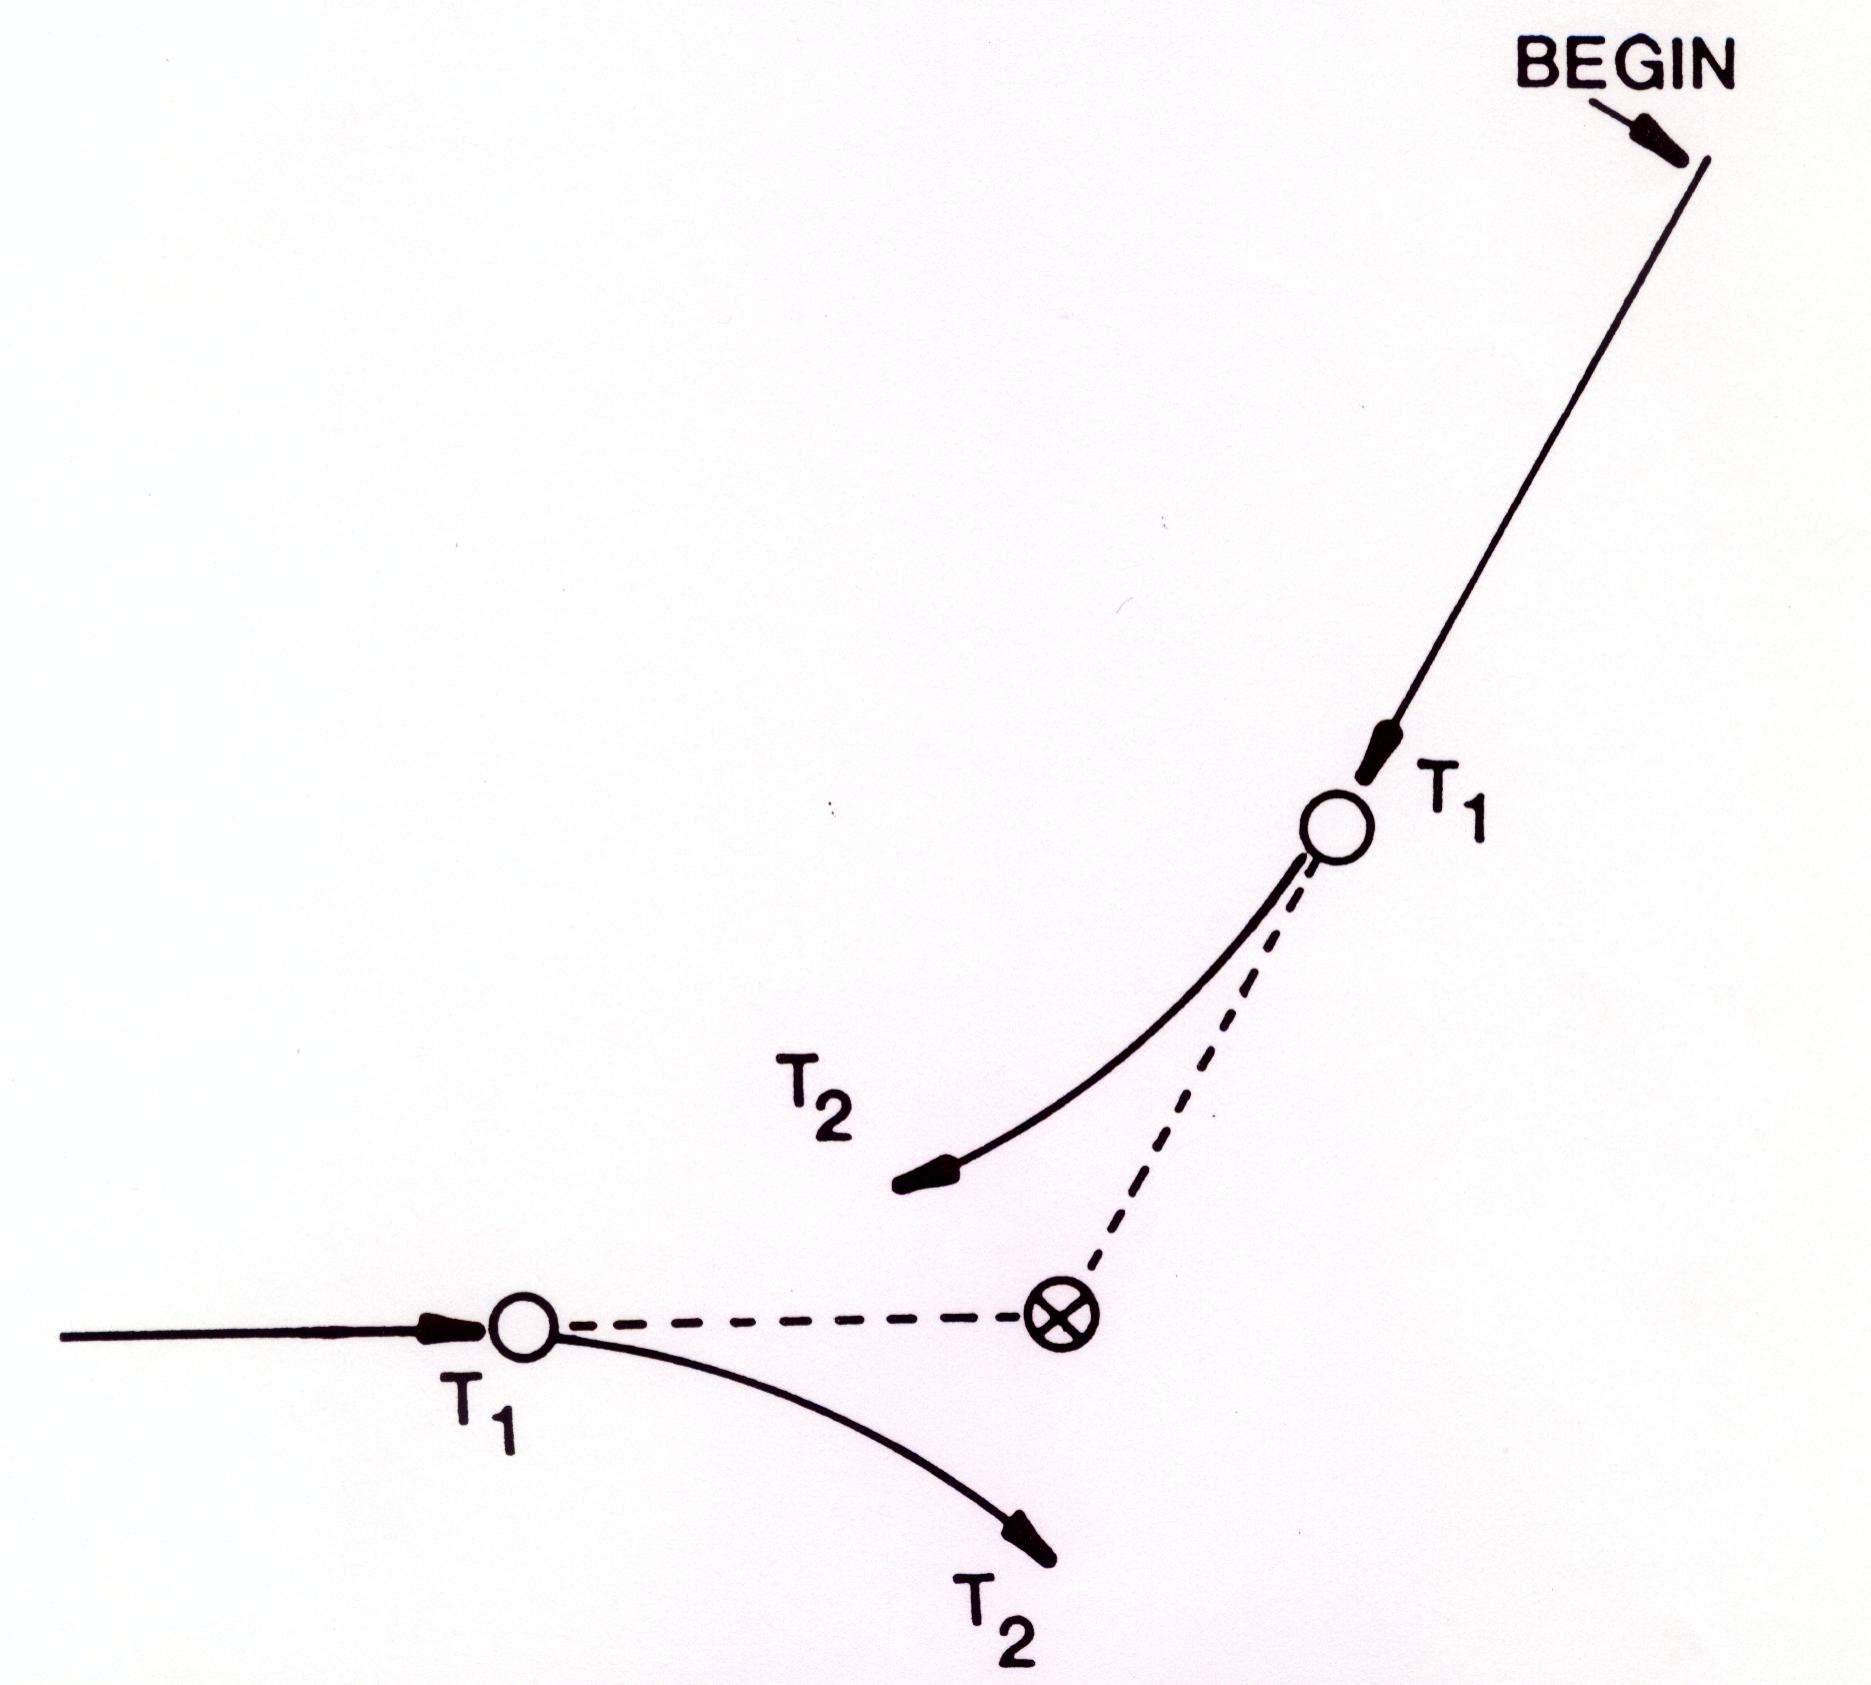
This diagram can be drawn in its entirety, or that portion up to the points marked T1 can be drawn first, followed by the dotted lines, and finally the lines T2. The diagram essentially displays the situation; the questions follow.Instructor’s Note:
Diagram V poses a different set of questions. The solid lines represent two moving objects at a given moment (T1). The dotted lines display what will result—a collision—if the two objects continue on their current trajectories. What is observed instead are the motions described by the curved lines (T2). Given the information that the two objects involved are atoms, students are asked how they would explain the change in trajectories from the collision to the non-collision course. This question usually solicits a number of explanations that have to do with physical forces, randomness, electrical valences, etc. Then the question is repeated, but this time the "objects" are identified as bicyclists (with due respects to Max Weber). Explanations that the students now offer are of a distinctly different kind. They have to do with intention, decision, choice, motivation, perception, etc., characteristics that are largely subjective in nature. Similar but more exaggerated differences are offered when explanations for an actual collision (rather than an avoided one) are solicited. The only difference between the two explanations is in the kind of object whose behavior is being explained
This diagram is extremely helpful in illustrating and discussing the differences between the physical and behavioral sciences, as well as in introducing the significance of subjective levels of meaning to both the doing of everyday life and the development of sociological accounts of how everyday life is done.
Diagrams can become increasingly complex, as the following two demonstrate.
DIAGRAM VI
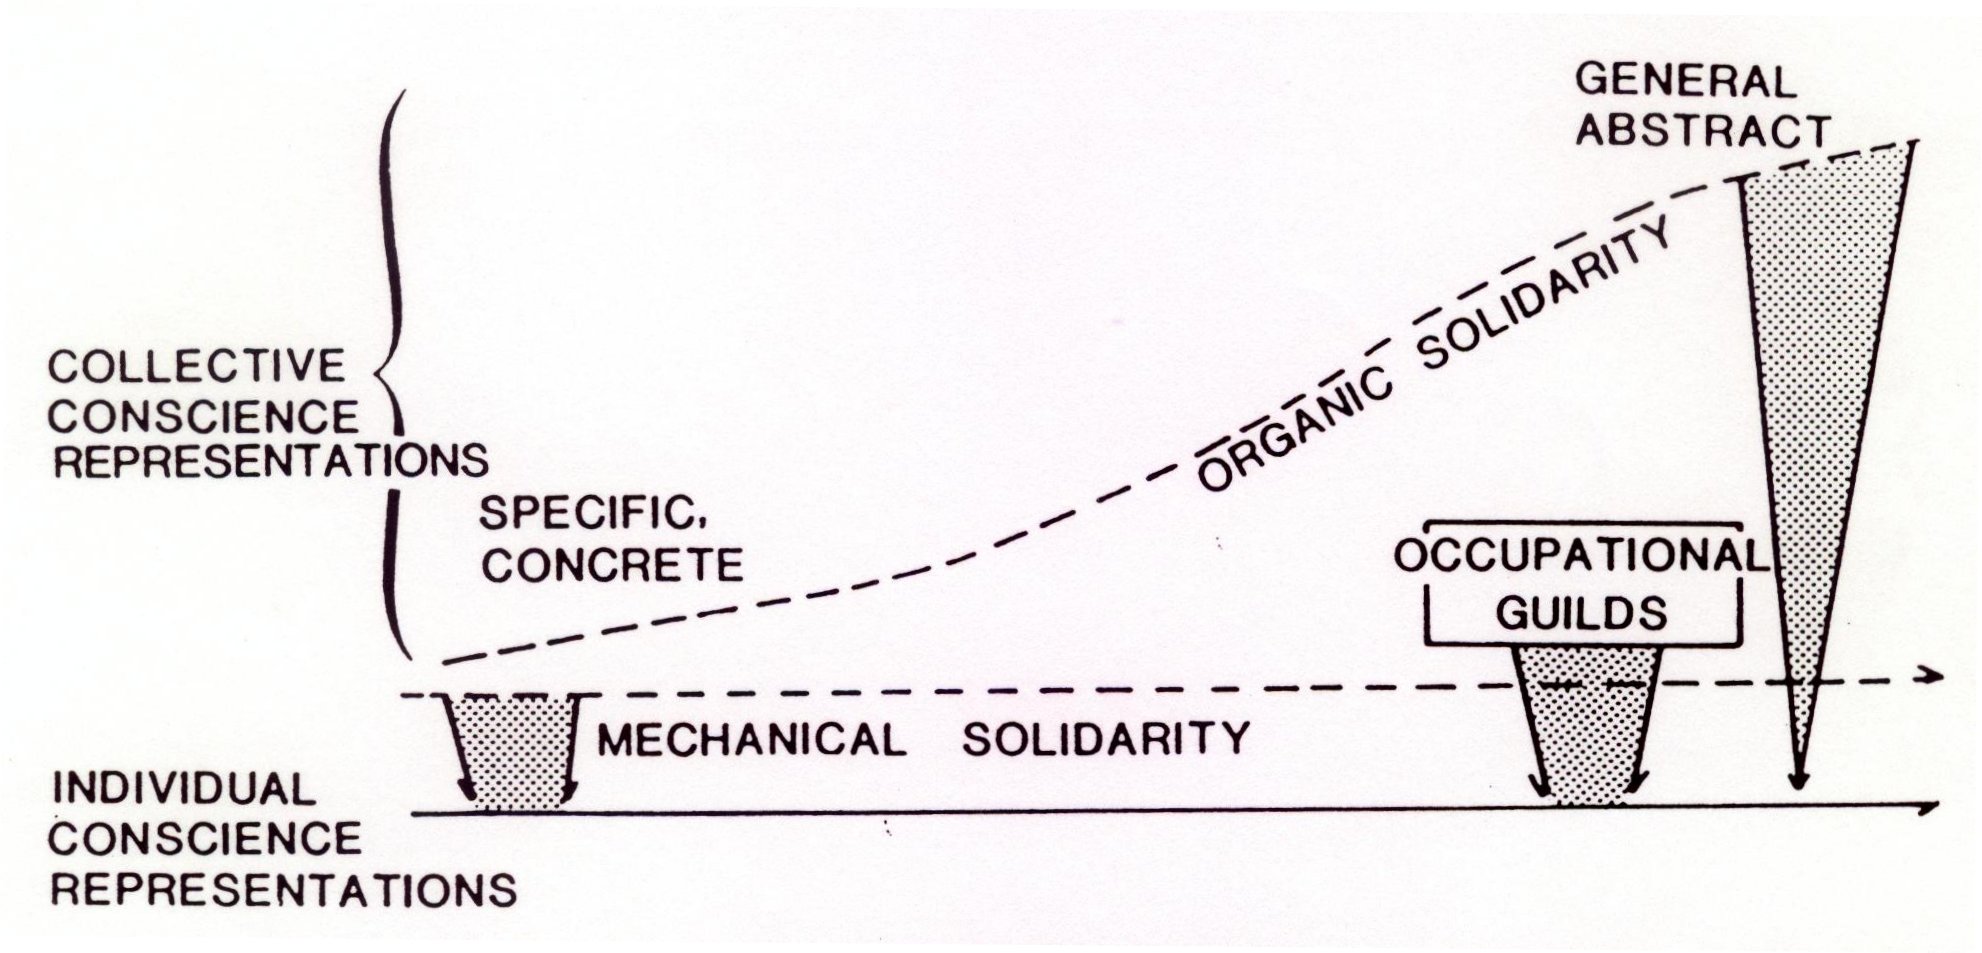
This diagram can be developed on the chalkboard as its explanation is being articulated. The left-to-right flow, indicating the historical development of Western society as a function of the increased division of labor and resulting "dynamic density," should be emphasized. The immediacy of the collective conscience in mechanical solidarity can be contrasted with its abstractness in organic solidarity. The differences in the "distance" between the collective conscience and its individual counterparts, as well as the "weight" with which the former bears down upon the latter, can be further expressed by the instructor’s active us of gestures and body English.Instructor’s Note:
Diagram VI attempts to display a portion of Durkheim's theory regarding the changing nature of social integration as society moves from mechanical to organic solidarity. As mechanical solidarity weakens it is gradually superceded by organic solidarity. The collective conscience, once specific and concrete, grows more distant and abstract. It thus exerts less of its constraining effect upon individual consciences. The collective representations must become general enough to circumscribe a large population with the varied range of social behaviors required by an ever-increasing specialization and division of labor. The collectivity— especially in the form of the State—becomes so ill defined and vague that the individual's sense of social membership and participation is weakened or lost. In this context, the need or the beneficial results of Durkheim's occupational guilds (as social integrating devices) become apparent as they re-introduce contexts of mechanical solidarity.
DIAGRAM VII
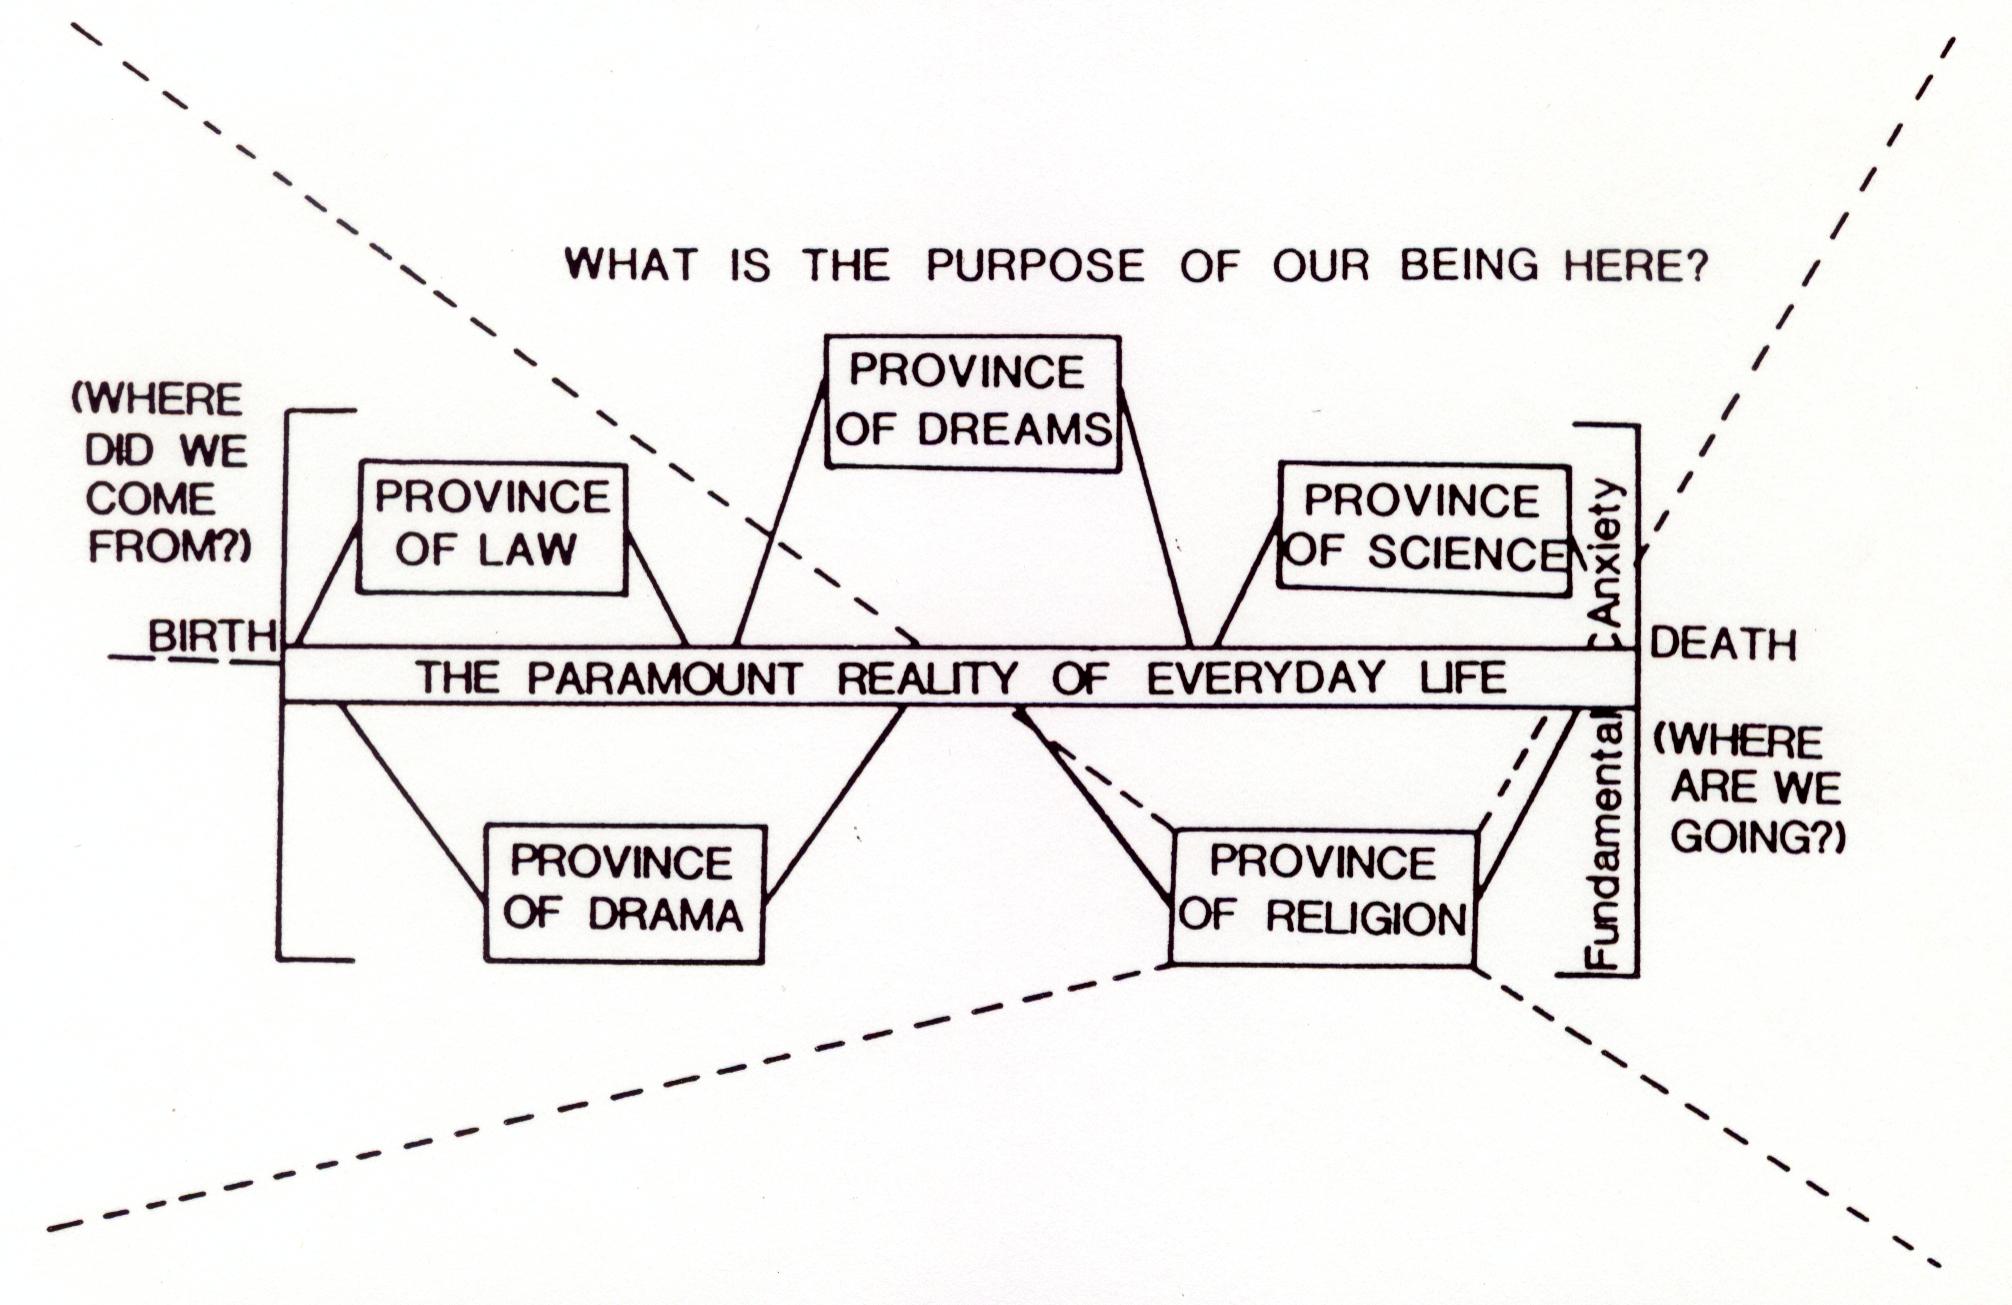
Diagram VII pushes toward the limits of two-dimensional presentations. The diagram attempts to display Alfred Schutz's ideas regarding the Paramount Reality and the seemingly lesser multiple realities or provinces of meaning which are contained therein. There are some fascinating paradoxes to model, as the diagram suggests.4
The Paramount Reality is bracketed by birth and death. Within this mutually shared, common sense, everyday frame of reference we grow older, age, and die. Within this context we grow older, age, and die. Within this context we are rooted in the physical parameters of bodily existence; we separately and alone experience the fundamental anxiety surrounding the awareness of our own death. Within this paramount reality we are temporarily able to shift our allegiance to such sub-realities as are identified on the diagram: law, drama, science, dreaming, and religion. Once entering into one of these subordinate provinces of meaning, bestowing upon it the accent of reality, a different cognitive style becomes operative. The leap into and out of a province is comparable to a leap of faith. But we always return to the paramount reality, for it is the reality in which the physical organism grows constantly older and inevitably dies, even against its will.
Among the various sub-provinces of meaning, religion is unique and singular. First, compared to the other provinces, religion functions especially to sustain individuals in their confrontation with this fundamental anxiety. Second, religion, almost by definition, claims to subsume within its parameters what is here identified as the Paramount Reality. In other words, within the Paramount Reality is a sub-province of meaning that is really a human representation of the "ultimate" reality within which the paramount reality is only a portion. In the diagram the dotted lines suggest this paradoxical relationship of a sub-reality more inclusive than the reality within which it is contained. Schutz is thus shown to illuminate Durkheim's concept of religion with striking clarity.
The historical confrontations between church and state and religion and science can be discussed in terms of which sub-reality should or can gain ascendancy over definitions of ultimate reality. In modern society, science and the law have in many ways combined to dominate definitions of reality, but only within the brackets of the paramount reality. Both sub-universes accept limits to their jurisdiction, leaving religion s the sole all-encompassing province of meaning.
While this discussion is far from complete, it does provide an idea of how provocative a diagram can be, and how useful this one is in exploring the ideas of both Schutz and others.
The last diagram. Diagram VIII, is more analytical than any of the preceding. It is useful in suggesting to students how sociological theories differ from one another and how several of them can be simultaneously utilized to view and better understand the same social phenomenon. The diagram not only distinguishes and relates several different theoretical approaches, but also argues for an eclectic appreciation of their distinctive strengths. The phenomenon to be explained is identified on the diagram simply as "B" occurring "now" (T2).
DIAGRAM VIII
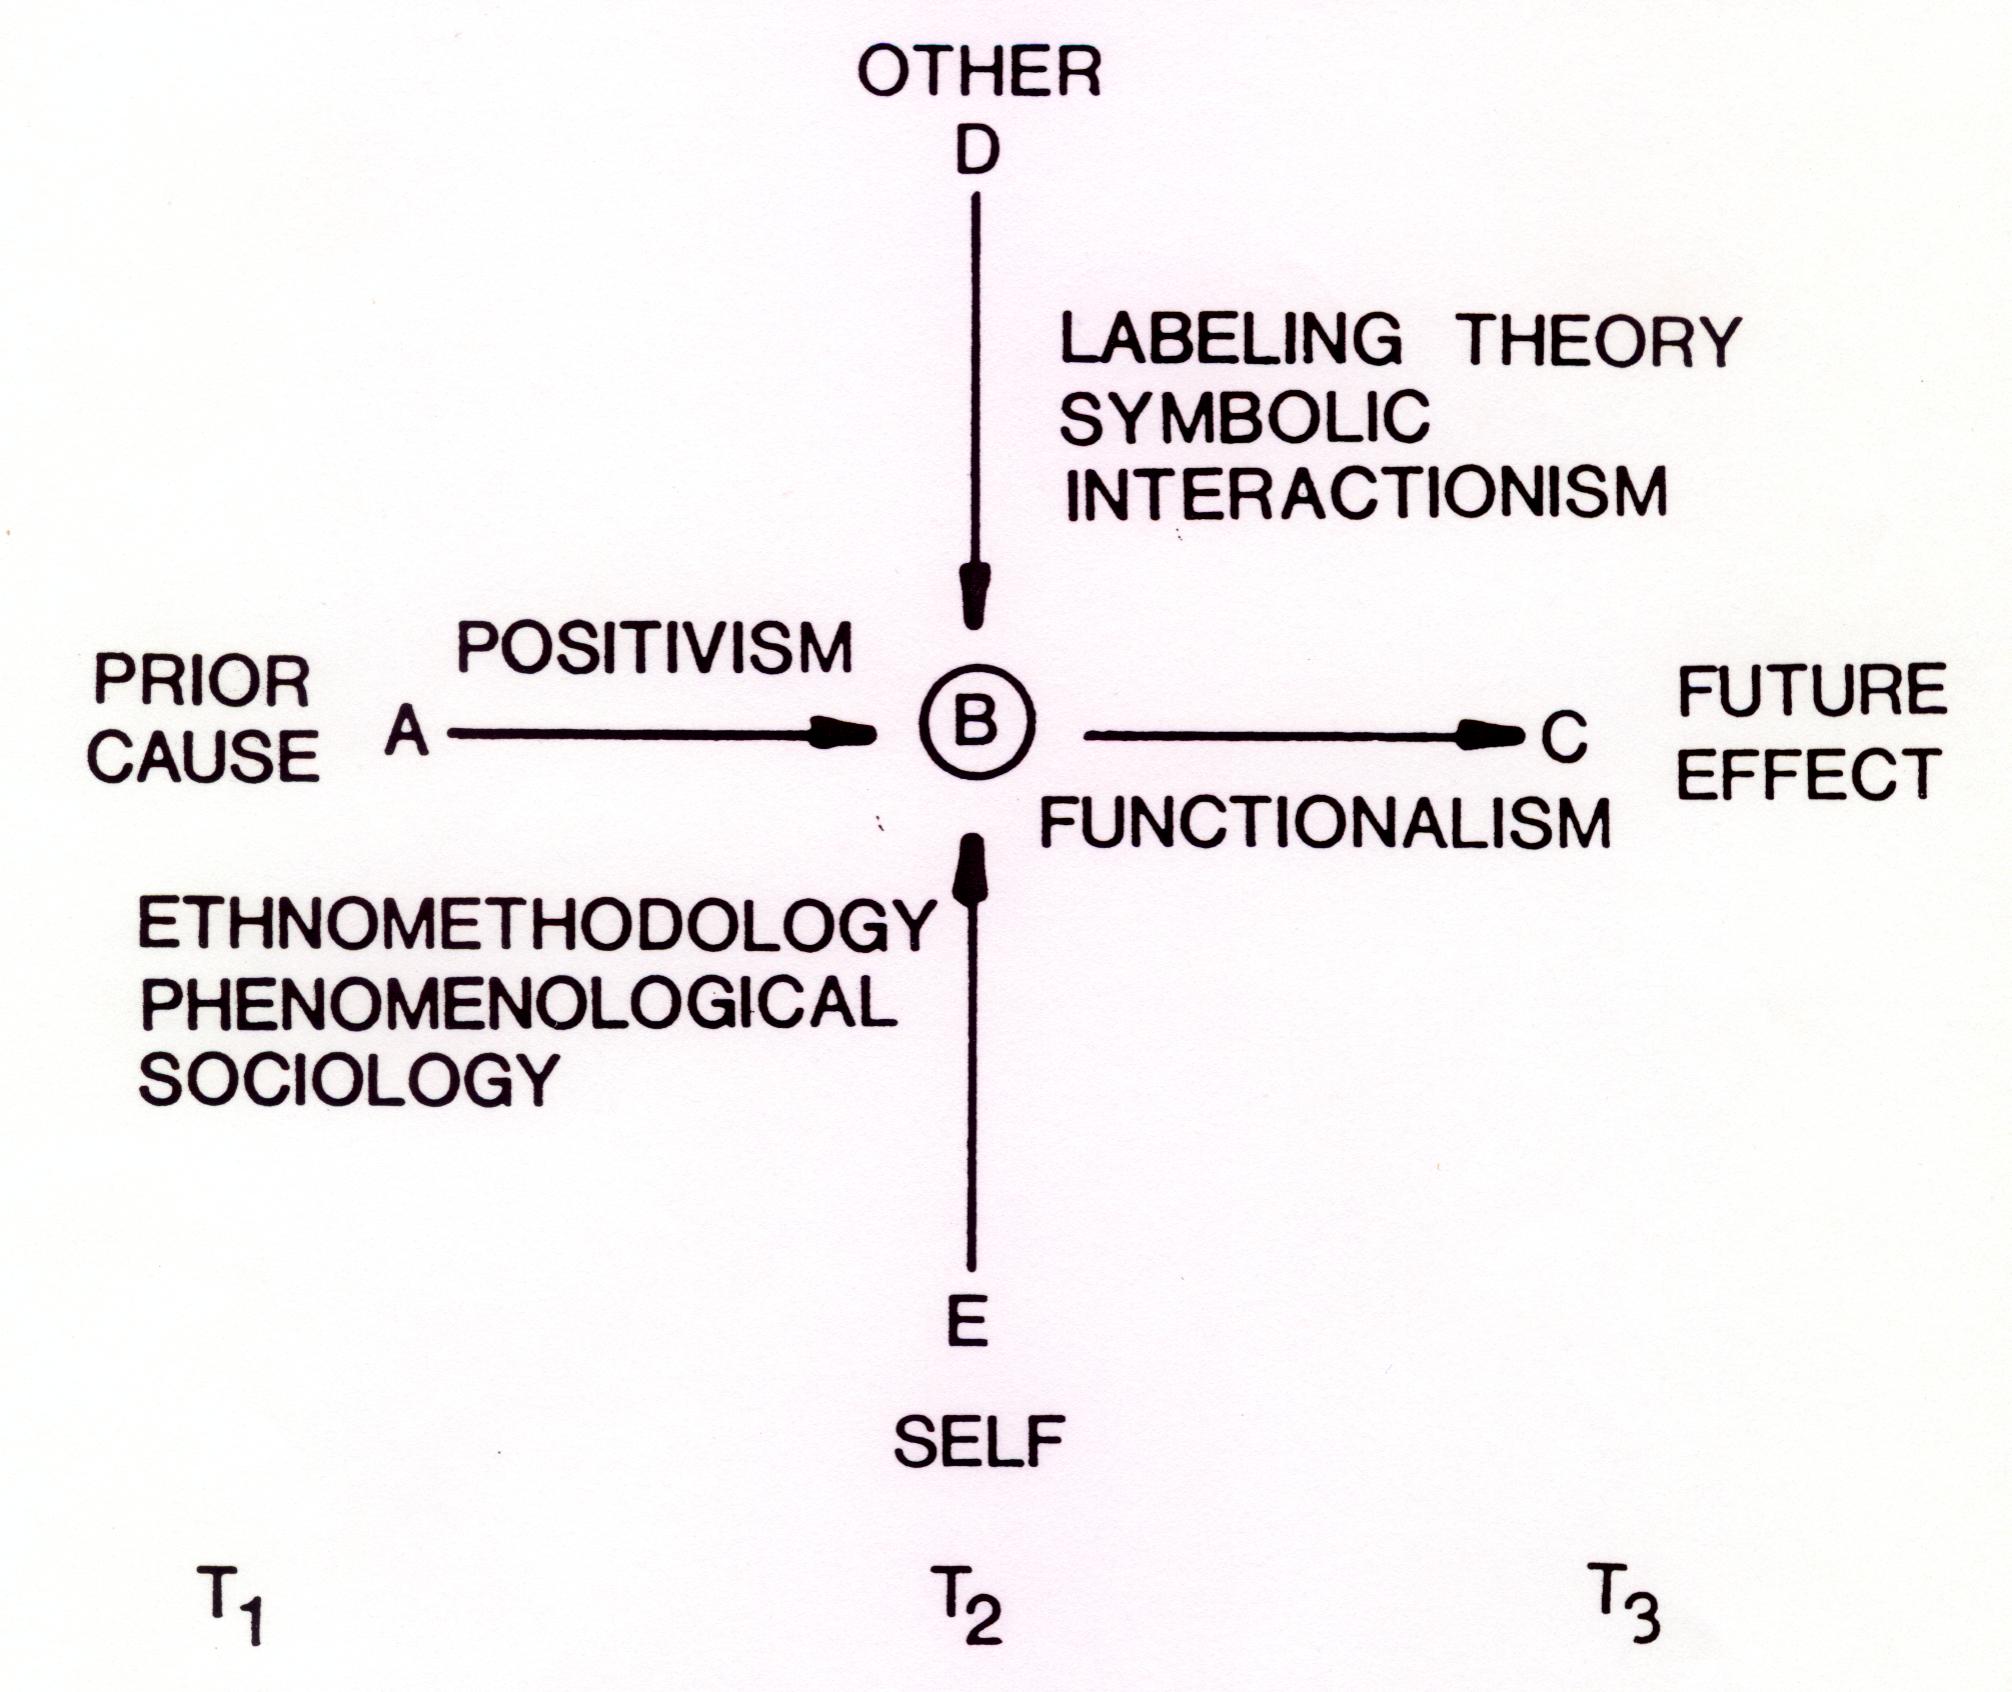
The "phenomenon B," as that which is to be explained is drawn first. By then drawing the remaining lines in alphabetical order, explaining them one at a time, the diagram displays the historical development of these various theoretical approaches. This also emphasizes both the complementary qualities of these diverse schools as well as their cumulative explanatory capacity.Instructor’s Note:
The classical, positivistic approach in science, to which many theories aspire, is based upon antecedent causes: "A" (T1) causes "B" (T2). Behaviorism is perhaps most readily associated with this category. But the social sciences deal with phenomena that are distinct from those of the physical sciences (from whose tradition this approach is inherited. Functionalism is a theory that reverses the fundamental assumption that cause must precede effect. The diagram clearly shows that "B" (T2) may also be "caused" by "C" (T3), a future effect. Where functionalism fits as an explanatory theory and why functional theorists have had such an affinity for the organic analogy, progress, teleology, and evolution is easily seen.
In addition to these two approaches, labeling and symbolic interaction theories—explanations for social phenomena which account for the phenomena in terms of how they are perceived, signified, and reacted to by social others—can also be located. 'Thus "B" may also be "caused" by "D", a contemporaneous, on-going occurrence of social responses of other parties to the phenomena being discussed. And yet individuals are at least partially accountable for producing the social phenomena with which they are involved or within which they are implicated. Therefore, there is another contemporaneous, on-going occurrence, represented in the diagram by "E"—theories that explain social phenomena in terms of the ways in which the individual collaborates, willingly or not, in the construction and maintenance of social reality. These are the contemporary theories of ethnomethodology and phenomenological sociology.
No diagram presented here is exhaustive of the subject matter it attempts to display. Rather, each suggests ways in which our understanding and insight may be both expanded and clarified through diagrammatic communication. As Albarn and smith (1977) have remarked:
The diagram is evidence of an idea being structured—it is not the idea but a model of it, intended to clarify characteristics of features of that idea. It is a form of communication that increases the pace of development, or allows an idea to function and develop for the thinker while offering the possibility of transfer of an idea or triggering of notions....
The old saying is that a picture is worth a thousand words. It may well be that, especially within the applied realm of education, diagrams and the process of drawing them can be even more valuable for teacher and student alike.
An earlier version of this article was presented at an NSF Chautauqua-type short course, Improving Curriculum Design and Instruction in Sociology and Related Disciplines. I am especially grateful to Sharon McPheron for her encouragement and editorial suggestions. The article was subsequently published in Teaching Sociology, Vol. 7, No. 4, July 1980, pp. 409-424.
BIBLIOGRAPHY
Albarn, K. and J.M. Smith (1977) Diagram: The Instrument of Thought. London: Thames and Hudson, Ltd.
Higman, H. (1976) "There is No Now." Ogden, Utah: Weber State College, Unpublished speech.
Holt, J. (1970) How Children Fail. New York: Dell Publishing.
Jaynes, J. (1976) The Origin of Consciousness in the Breakdown of the Bicameral Mind. Boston: Houghton Mifflin Company.
Koestler, A. (1964) The Act of Creation. New York: Dell Publishing.
McDonnell, V. (1978) "Confessions of a Textbook Writer." American Psychologist 33 (February): 159-169.
Mehrabian, A. (1968) "Communication Without Words." Psychology Today 2 (September): 53-55.
Ornstein, R.E. (1973) The Psychology of Consciousness. New York: Viking Press.
Sackler, D. (1975) Thorstein Veblen and the Institutionalists. Boulder, Colorado: Colorado Associated University Press.
Tenhouten, W.D. and C.D. Kaplan (1973) Science and Its Mirror Image: A Theory of Inquiry. New York: Harper and Row.
Wittrock, M.D. [ed.] (1977) The Human Brain. Englewood Cliffs, NJ: Prentice-Hall.
ENDNOTES
There are variations in this pattern between males and females and right and left-handed persons, but this generalization is adequate for our purposes here.2 In a fascinating entry dated April 24, 1959, in his book-journal How Children Fail, John Holt imaginatively describes similar process.
Although pre-drawn diagrams shown by overhead projectors or handed out in mimeographed form have a more finished and neater appearance (as evidenced by those presented in this article) at the same time they lack these dramatic and dynamic dimensions and are, I believe, less effective. This diagram also approaches the limits of two-dimensional representation and suggests the possibilities of working in three dimensions with more mechanical graphical devices such as models or other "assemblages."