This audit report became famous because of the events that is was part of that led to the firing of the police chief. I cite the report here, however, for a different reason--its innovative use of graphics and correlation analysis.
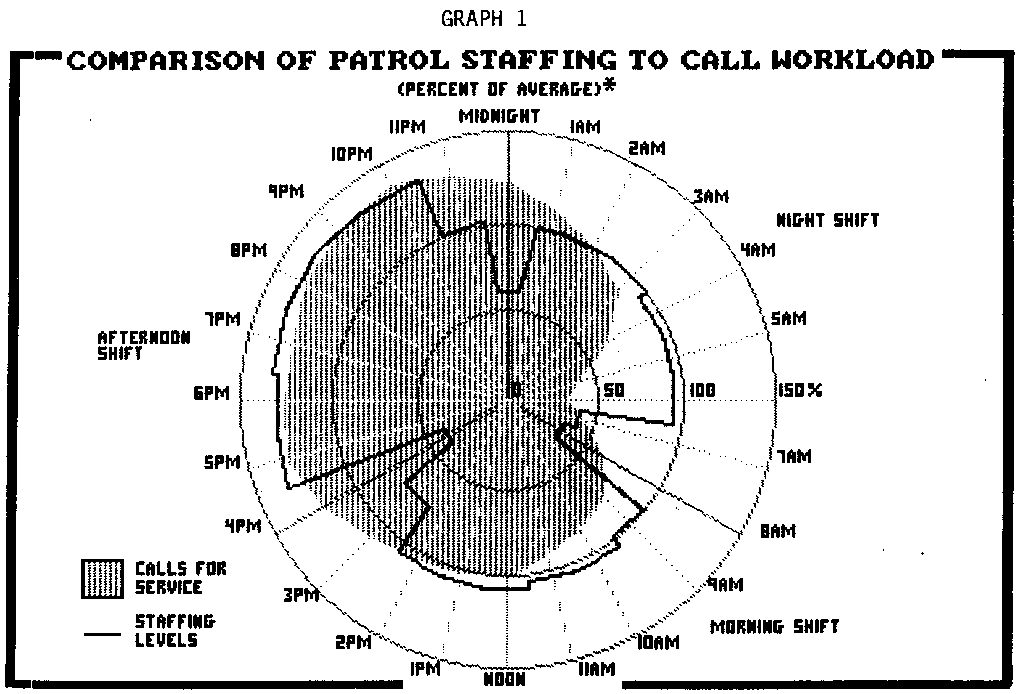
This analysis examined how well the use of police officers doing patrol duty corresponded to the need for patrol officers. To do this the audit examined how closely 1) the number of patrol officers on duty at different times of the day corresponded to 2) the average number of calls for service that come in during different times of the day.
Graph 1 shows how variables 1) and 2) correspond for the existing
practice of scheduling officers using three 8-hour shifts:

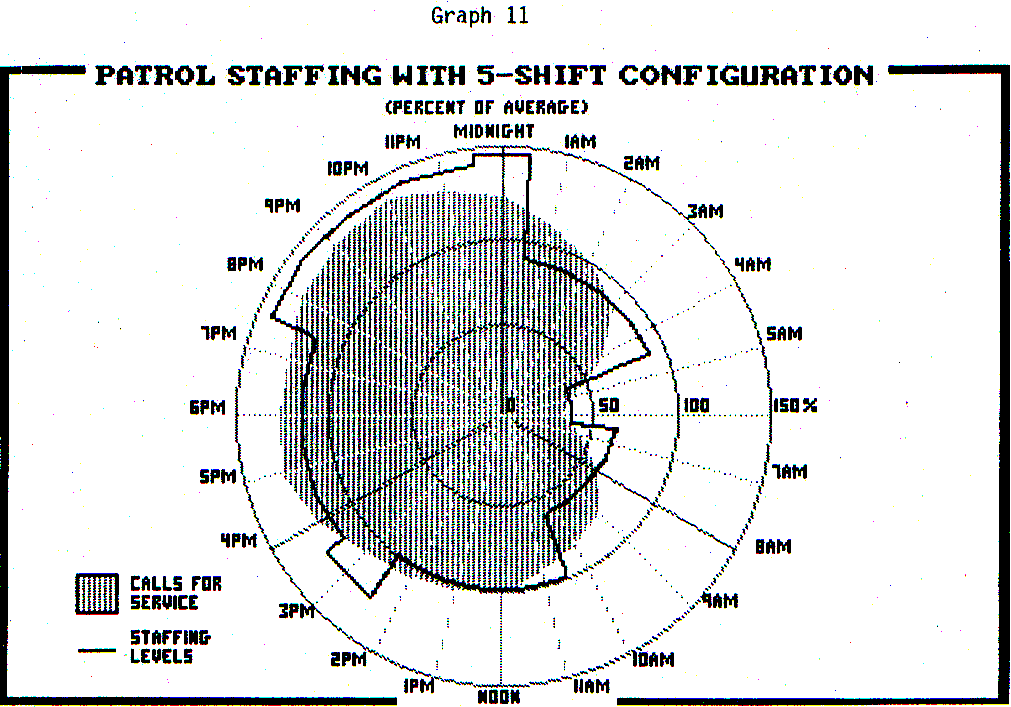
Graph 1-1 shows how variables 1) and 2) correspond for an alternative
to the scheduling based on a five-shift configuration:

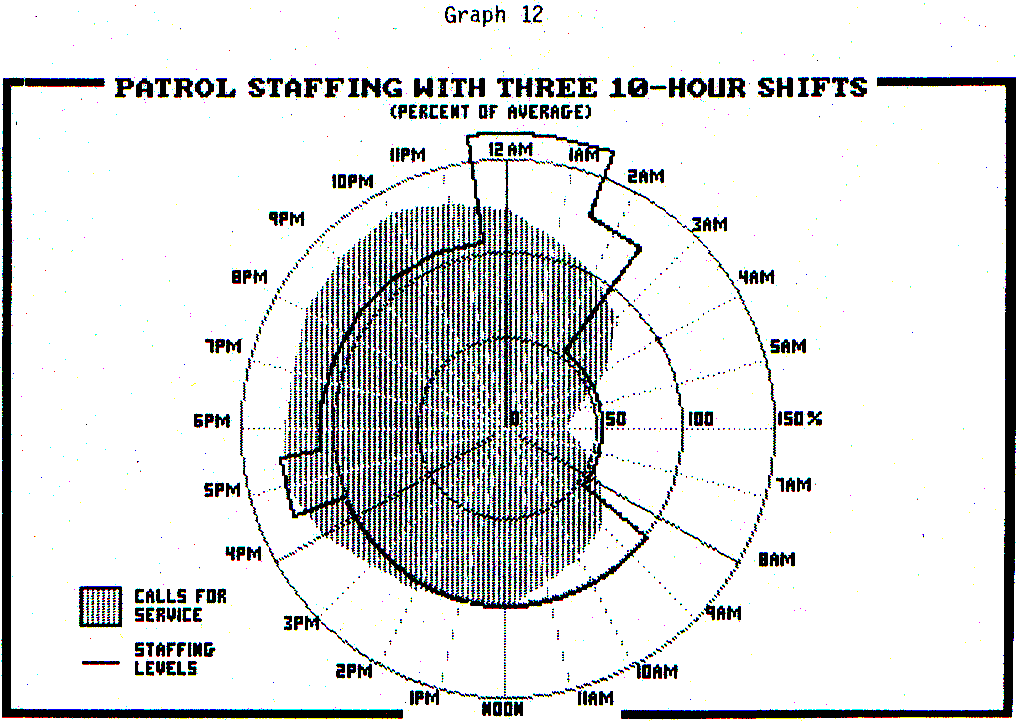
Graph 1-2 shows how variables 1) and 2) correspond for an alternative
to the scheduling based on a three ten-hour shift configuration:

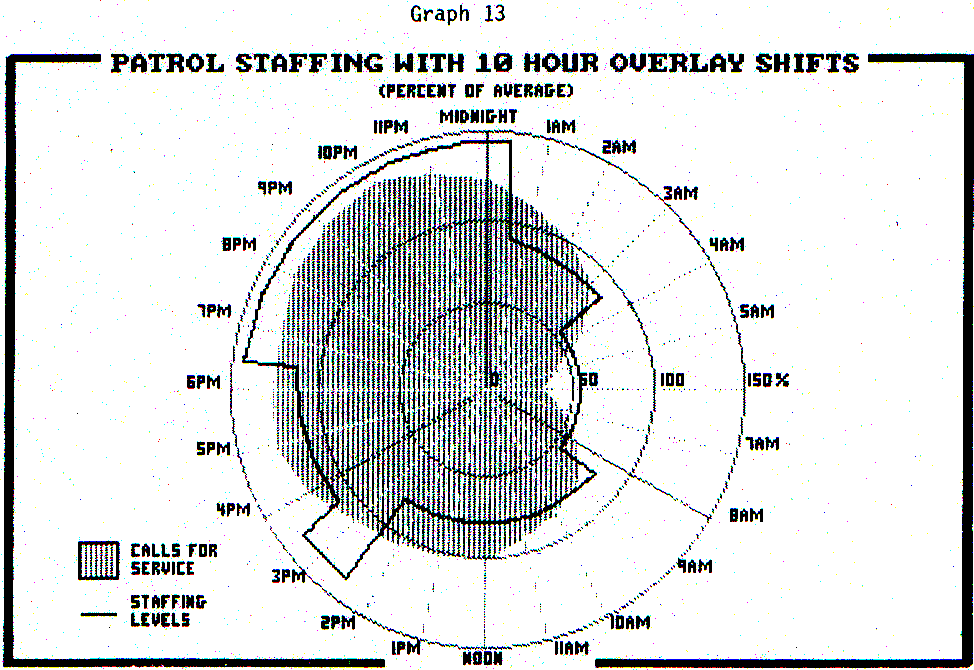
Graph 1-3 shows how variables 1) and 2) correspond for an alternative
to the scheduling based on a ten-hour overlay shift configuration:

Now--Examine the above graphs carefully and draw your conclusions about how well the existing shift pattern met demands for service, compared to the alternative shift patterns.
To summarize how well variables 1) and 2) fit in each graph, the audit report also presented correlations computed between the two variables. The correlations were:
(Note: The audit report actually presents the squared correlations; take their square root to get the correlations reported above.)
How do the conclusions implied by these correlations compare to the conclusions that you drew from the graphs?
I have copies of the original audit report should anyone want to borrow a copy.