There are several different kinds of functions out there (linear, polynomial, rational, exponential, logarithmic, periodic ............)
We can actually use many of these functions to fit data sets and find trend lines!
I have searched the web and found some examples of what kinds of data sets might fit to what kinds of functions. I have found ones for linear, exponential, logarithmic, periodic, and quadratic. At the bottom of this page there are links so that you can download the actual data sets I used on a spreadsheet. You can also link to the original websites that I got them from. Finally, I did a special exploration of the quadratic data set. Download the spreadsheet file and see what I did!
Linear Function
Did you know that the population of China grows linearly?
From the China Population Information and Research Center
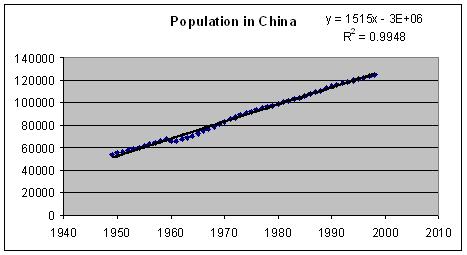
Check out the website that contains this data set of China's Population.
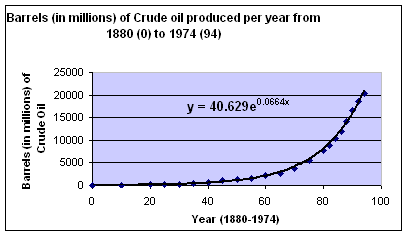
Exponential Function
From the Data Story Library (Energy)
Annual World Crude Oil Production from 1880 to 1974
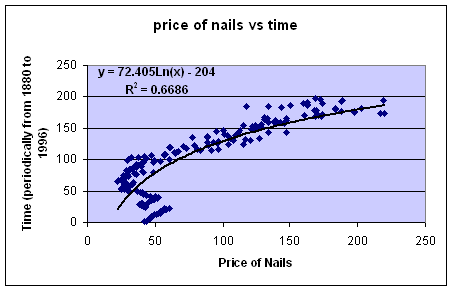
Logarithmic Function
From the TimeSeries Data Library (Micro-Economics)
Nail prices, 1800-1996, in constant $
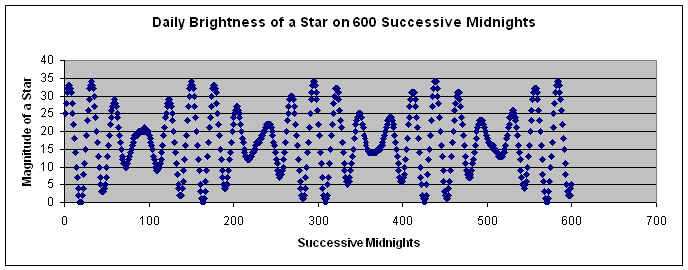
Periodic Function
From the Time Series Data Library (Physics)
Daily brightness of a variable star on 600 successive midnights
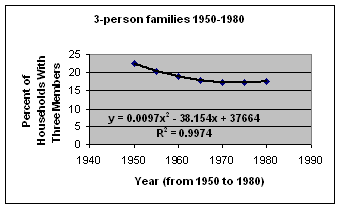
Quadratic Function
Percent Distribution of Number of Households
From Infoplease
There is much more to this data set:
Down Load this Spreadsheet Exploration and Check it Out!