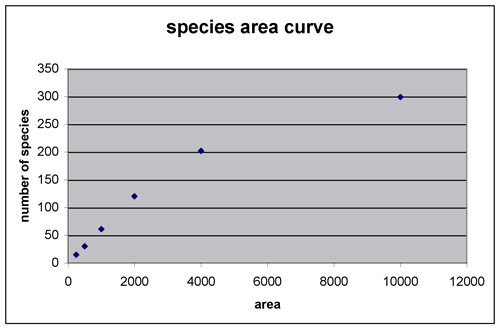
because of the curve, decreasing the number of species has little effect at the far top right
but as you loose more and more species the relative loss from the same change in area
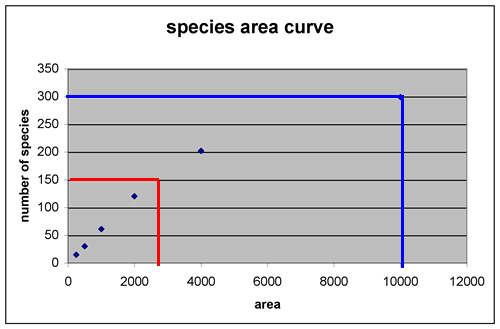
in the figure below, decreasing the area by about 4 times only decreases the species by 2 times
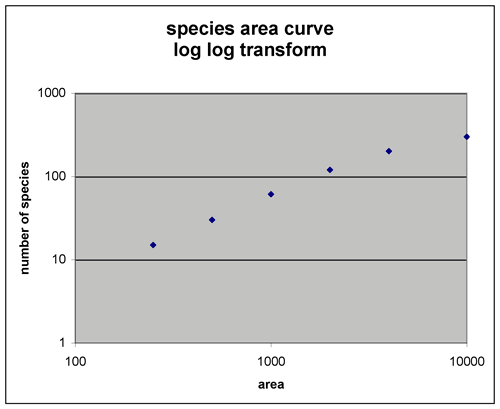
some species area curve are even "shallower"
decreasing the area by 10 times only results in a 2 fold decrease in species
(but remember by "only" we are talking about extinction, potentially irreversibly)

some species area curve are even "shallower"
decreasing the area by 10 times only results in a 2 fold decrease in species
(but remember by "only" we are talking about extinction, potentially irreversibly)
