Exercise 3: Growth Models - STELLA tutorial |
I made this page narrow so that you can have the tutorial window open off to the side of a STELLA page. At the end of this assignment, you will be asked to print a model that you made and answer a question by writing on that page. |
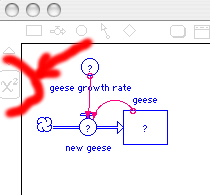
A. Constant ratio - Exponential growth model1. Open up STELLA 2. Click on the stock icon, move your mouse to the page and click again. Name this stock "animals" (or any growing organism you choose). 3. Click on the flow icon. Move your mouse to the left of the stock a couple inches, click and hold down while you drag toward the stock and don't release until the mouse pointer is in the box. You should have a cloud (source) at one end and the flow should be connected at the other end. Label this something like "new animals" You can test this by selecting the stock and moving it a bit. If there is a cloud underneath, it didn't connect. It's easier just to start over. 4. Removing connections and icons in STELLA is satisfying and therapeutic. Select the "dynamite" icon, move you mouse over the offending icon and blow that baby up! This program would even be better with sound effects. 5. Create a convertor and name it something like "animal growth rate". This will hold the constant growth rate that is used to determine the flow of new animals into the stock. 6. Create an information links from the stock to the flow valve control and from the convertor to the flow valve. Try if you like to go the other way, STELLA won't let you. This is because information can't flow to a stock. That makes more intuitive sense if the stock is water or carbon than with animals. But the stock of animals is the number or amount, not actual animals. 7. Your diagram/map should look like this: |
8. Now you need to add values and equations to this diagram. Start by toggling the STELLA window from the "map" mode to the "equation" mode. Map mode tab says "map". Equation mode tab says "equation".
|
9. Enter the appropriate starting values of equations by double clicking on the icon which will open a dialog box.
|
10. Create a graph of this
|
11. set the time of the simulation
|
12. Run the model
13. Observe and be able to describe every feature of the output. You designed the model, you need to be able to describe all features. Before proceeding to section B, please answer question 1 on your handout.
|
B. Negative feedback - the "Logistic" equation |
1. Modify your current exponential growth model by adding a new convertor and label it "carrying capacity". Then draw a connection to "new geese" flow rate controller. 2. put a value of 1000 in that as an example starting point 3. change the flow equation to the "Logistic" model -
4. run the model and adjust the time, growth rate and carrying capacity until you get the characteristic sigmoidal curve 5. Modify the graph to add in the flow
6. run the model again
7. In what regions does positive feedback dominate and in what regions does negative feedback dominate?
|
C. Assignment1. Create another graph on the same page as the model and number+flow vs. time graph. Double click on the Y-axis and select "scatter" as the graph type. Put the animals onto the X axis and new_animal flow onto the Y axis. 2. Run the model several times using different parameters (starting number, carrying capacity and growth rate). 3. Copy and paste this new graph into your Word document. Write an explanation of what each of the two figures show and how they are related. |