Links to map images
- Whole map (300 dpi JPEG, 1992 Kb)
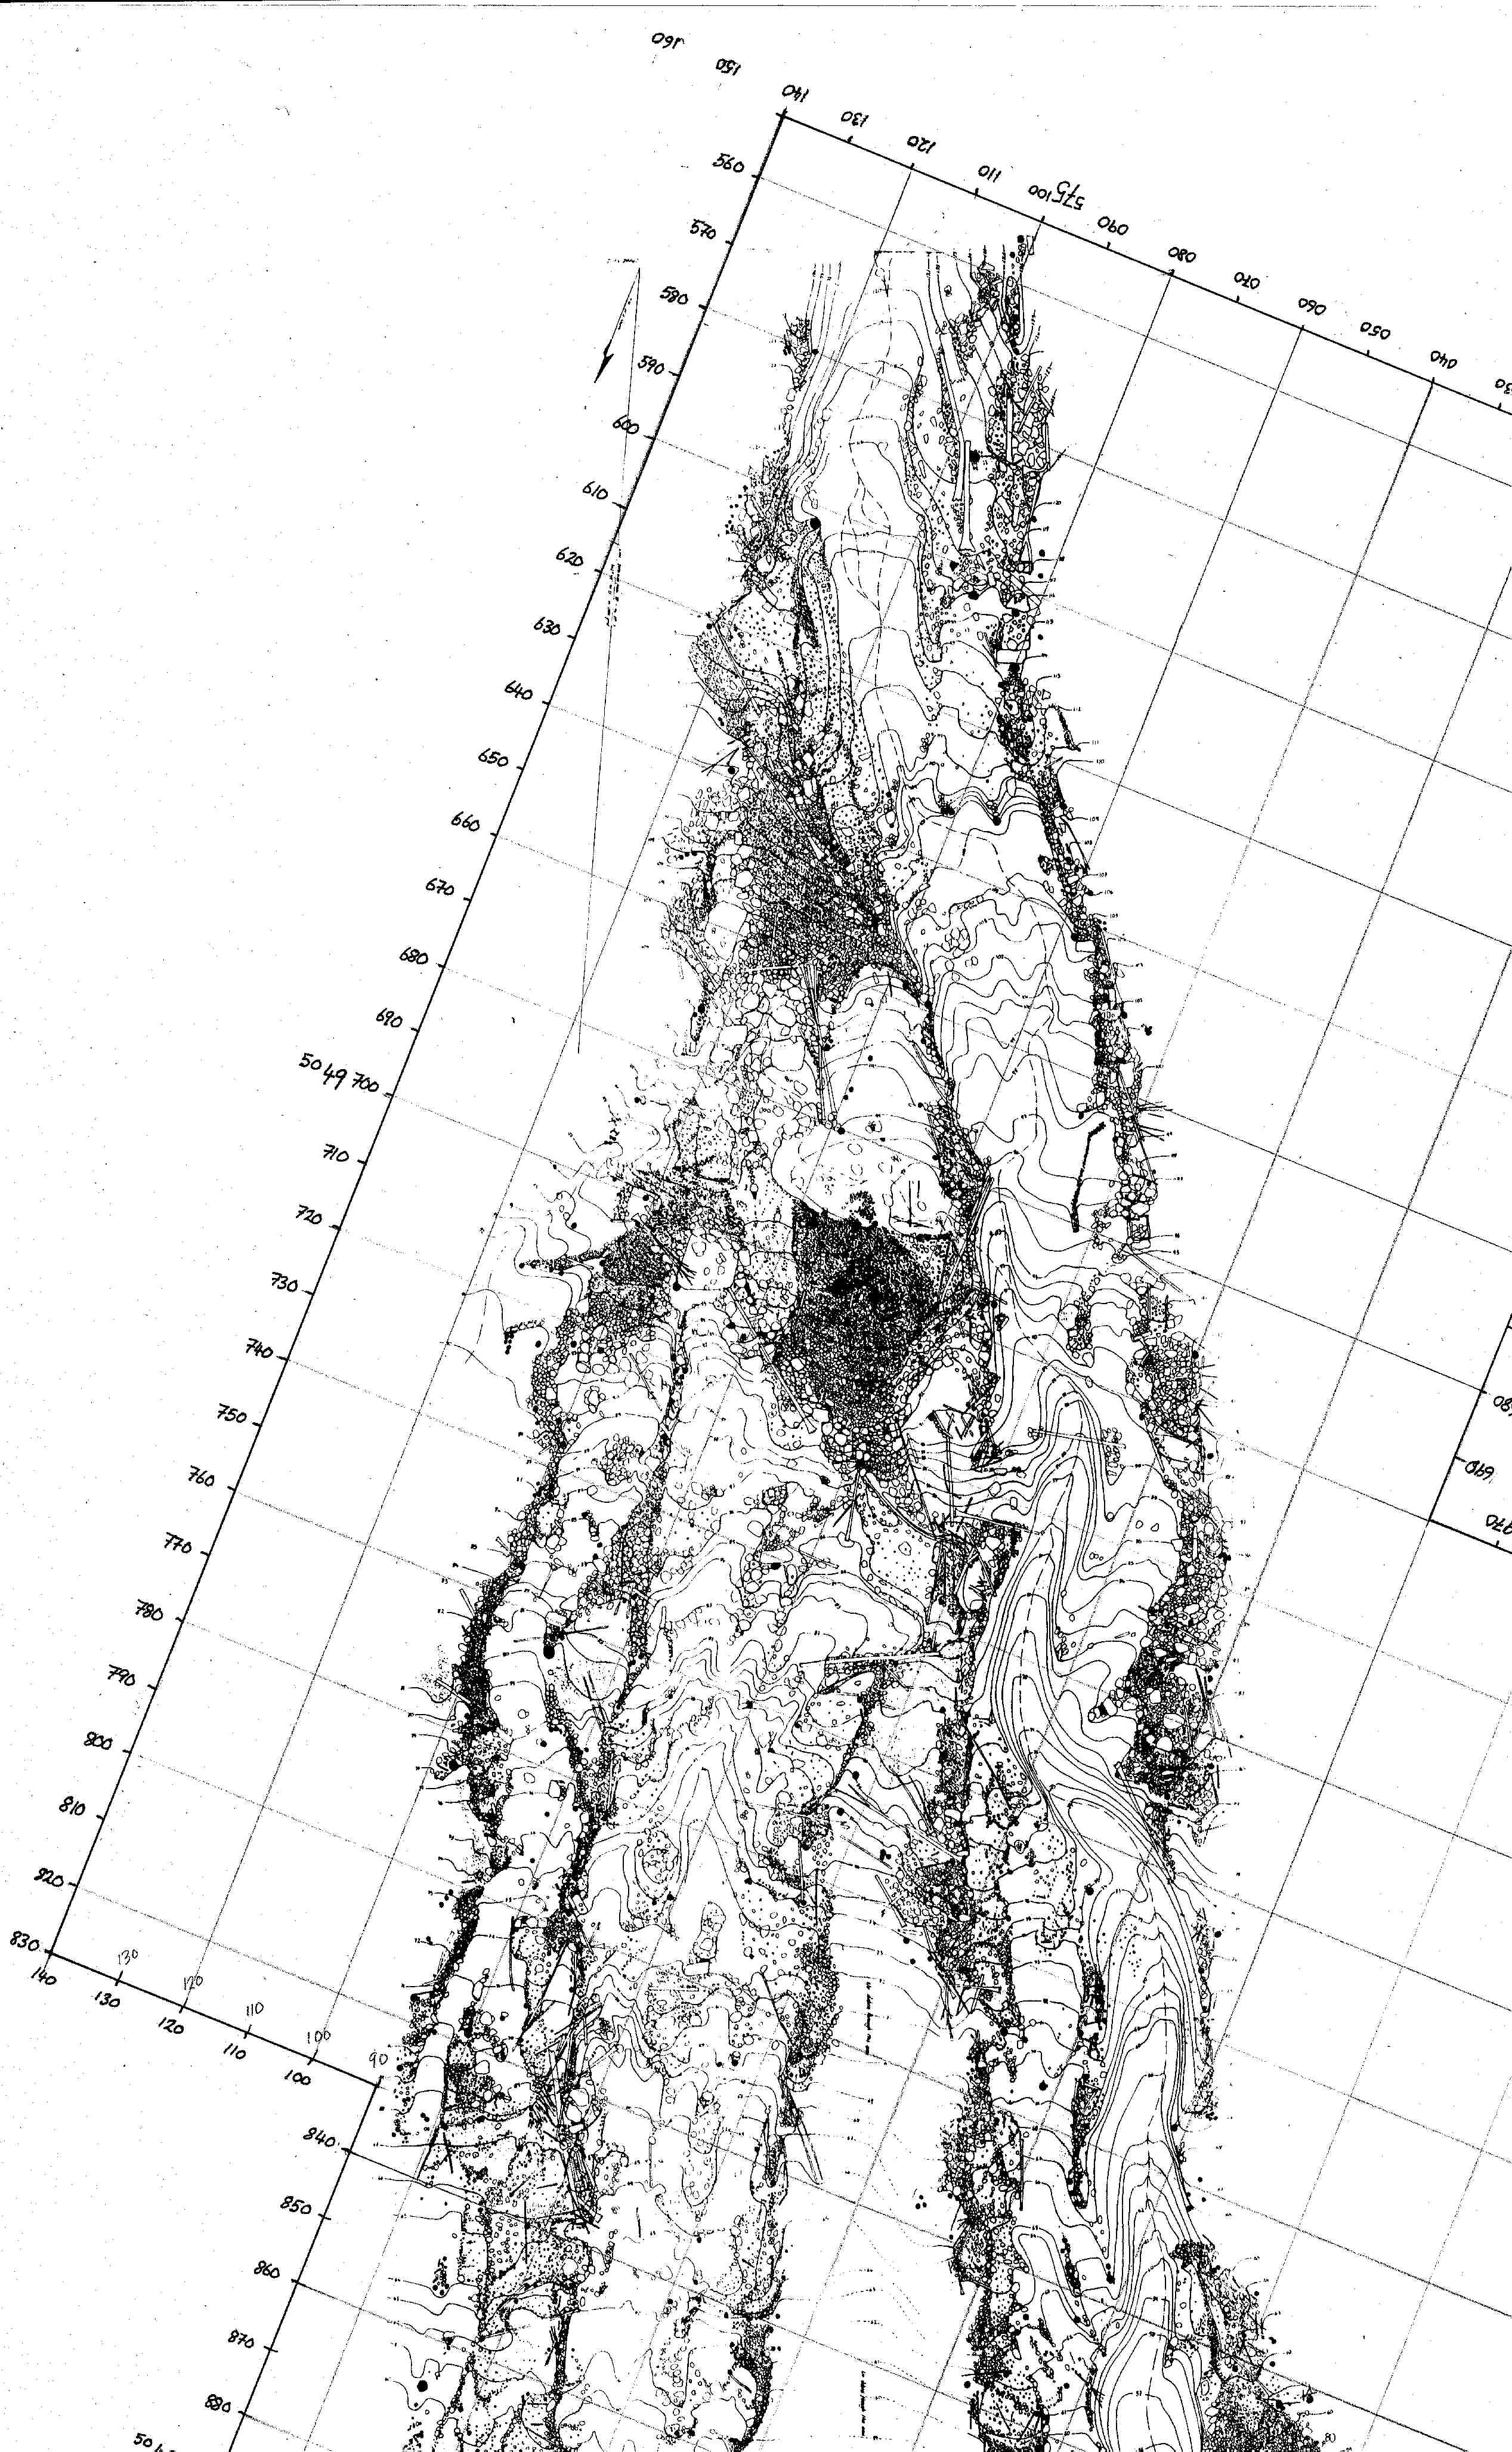
- Upper portion of flow (300 dpi JPEG, 886 Kb)
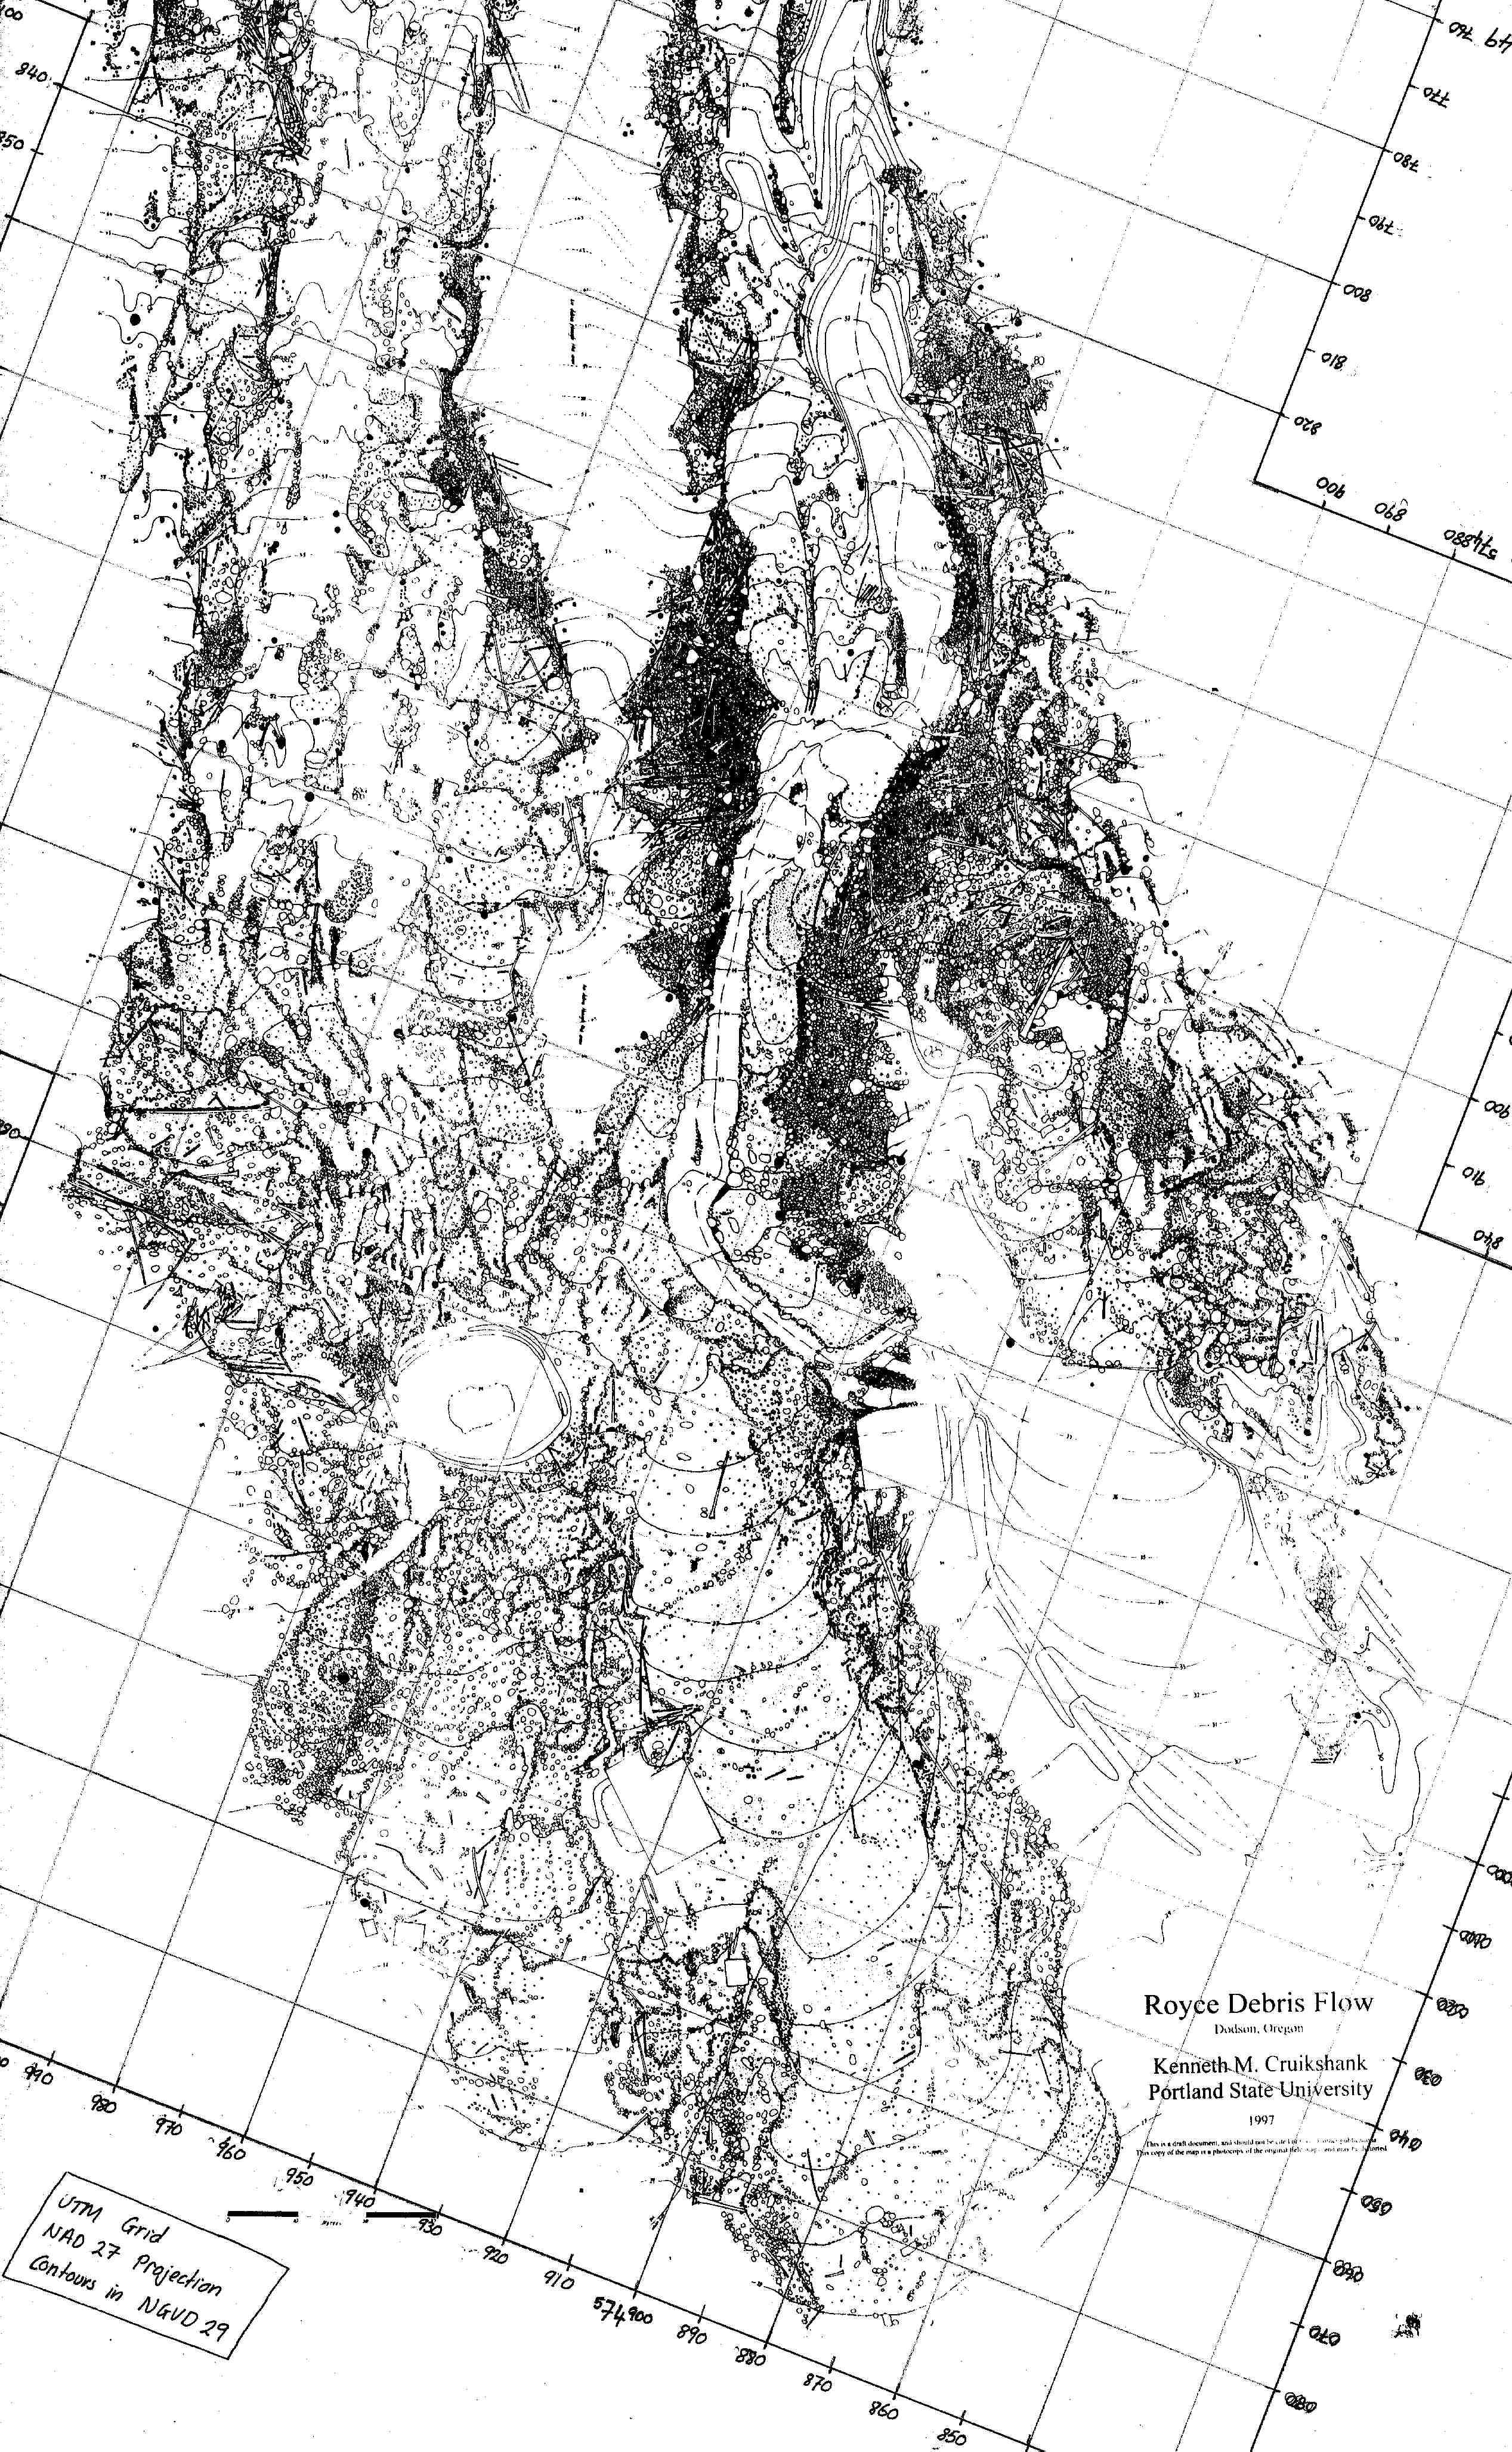
- Lower Portion of flow (300 dpi JPEG, 1229 Kb)
How the map was made
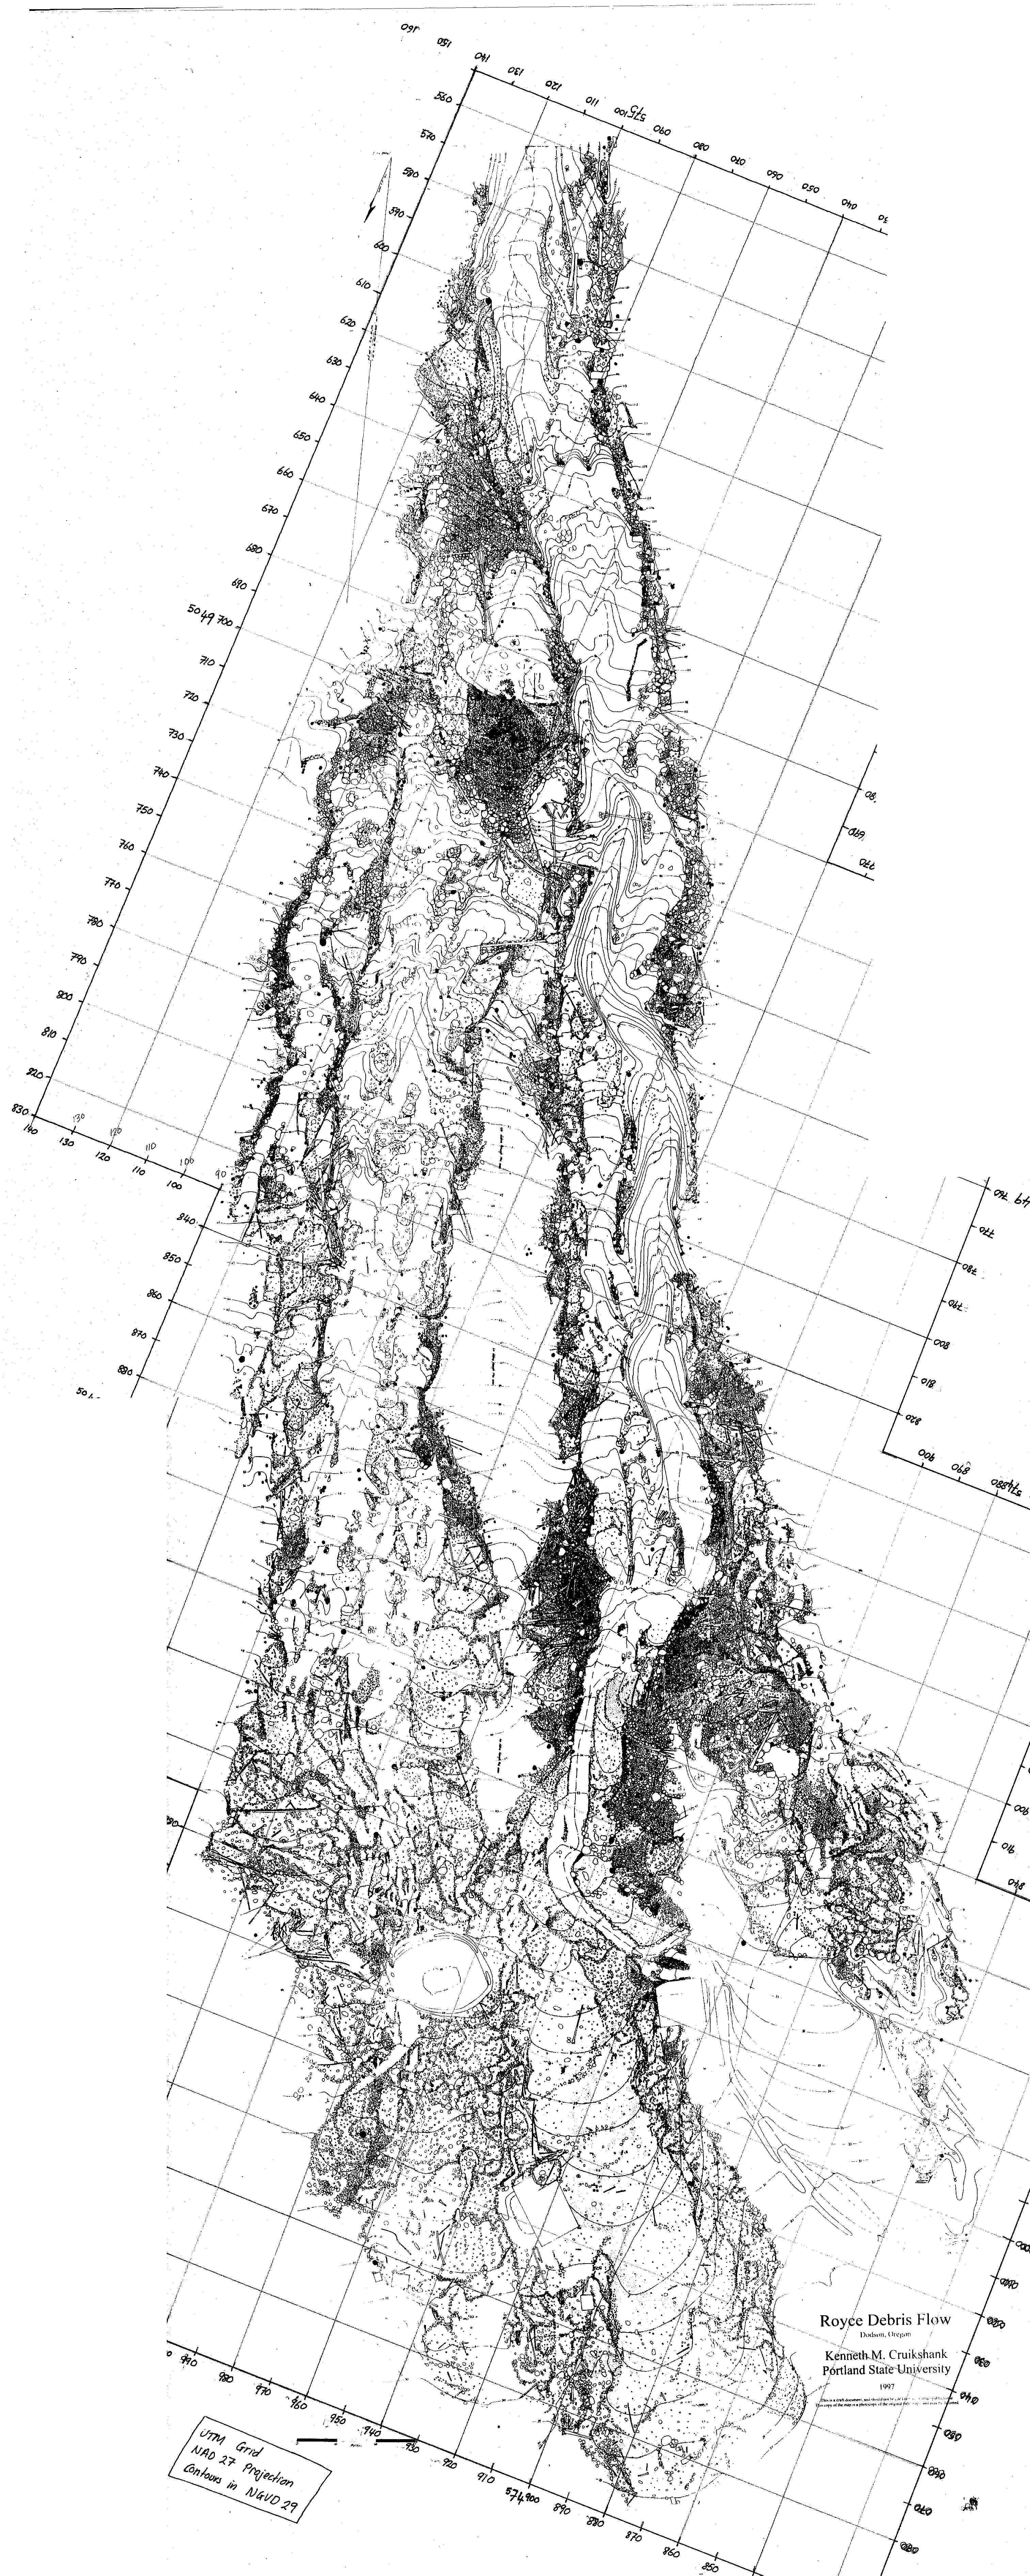
A Total Station was used to survey in 750 control points. At each control point location some flagging with the point number was left. The data from the Total Station was downloaded to a computer and plotted on ten overlapping 22"x17" sheets of paper. On each map sheet the relative location of points, point number, and elevation were plotted. The scale of the maps was 1:250 (1 cm represented 2.5 m).
The map sheets were then taken to the field. By standing on one of the field marks and looking towards other field marks major boulders (greater that about 1 m in diameter) and trees were drawn in. These major features could then be used as control points for mapping smaller features. This procedure was continued until the debris flow deposits had been completely mapped. When the features were all mapped, the contours were drawn. By using the elevation of control points and an Abney level the path of a contour across the mapped features was determined.
When all the sheets were mapped, they were joined to form a single map. This map was then field checked. The map presented here is the compilation of the field maps. The final map is currently being drafted.
At a later date the location of cross-section lines was determined and the lines surveyed with a Total Station. The sections were then drawn using the same technique as the map. The total station was also used to measure the height and slope of deposit in several places.
I did not draw every boulder! Boulders larger than 1m in diameter are correctly drawn. In the boulder fields I show the approximate size and packing of the blocks. Where there are small groups of boulders I usually represented the approximate size and number.
The map